
GoodbyeDPI — Deep Packet Inspection circumvention utility
This software designed to bypass Deep Packet Inspection systems found in many Internet Service Providers which block access to certain websites.
It handles DPI connected using optical splitter or port mirroring (Passive DPI) which do not block any data but just replying faster than requested destination, and Active DPI connected in sequence.
Windows 7, 8, 8.1, 10 or 11 with administrator privileges required.
Quick start
- For Russia: Download latest version from Releases page, unpack the file and run 1_russia_blacklist_dnsredir.cmd script.
- For other countries: Download latest version from Releases page, unpack the file and run 2_any_country_dnsredir.cmd.
These scripts launch GoodbyeDPI in recommended mode with DNS resolver redirection to Yandex DNS on non-standard port (to prevent DNS poisoning).
If it works — congratulations! You can use it as-is or configure further.
How to use
Download latest version from Releases page and run.
Supported arguments
To get relevant information about your version of the program, use the -h (—help) argument at startup.
Usage: goodbyedpi.exe [OPTION...]
 -p          block passive DPI
 -q          block QUIC/HTTP3
 -r          replace Host with hoSt
 -s          remove space between host header and its value
 -m          mix Host header case (test.com -> tEsT.cOm)
 -f <value>  set HTTP fragmentation to value
 -k <value>  enable HTTP persistent (keep-alive) fragmentation and set it to value
 -n          do not wait for first segment ACK when -k is enabled
 -e <value>  set HTTPS fragmentation to value
 -a          additional space between Method and Request-URI (enables -s, may break sites)
 -w          try to find and parse HTTP traffic on all processed ports (not only on port 80)
 --port        <value>    additional TCP port to perform fragmentation on (and HTTP tricks with -w)
 --ip-id       <value>    handle additional IP ID (decimal, drop redirects and TCP RSTs with this ID).
                          This option can be supplied multiple times.
 --dns-addr    <value>    redirect UDP DNS requests to the supplied IP address (experimental)
 --dns-port    <value>    redirect UDP DNS requests to the supplied port (53 by default)
 --dnsv6-addr  <value>    redirect UDPv6 DNS requests to the supplied IPv6 address (experimental)
 --dnsv6-port  <value>    redirect UDPv6 DNS requests to the supplied port (53 by default)
 --dns-verb               print verbose DNS redirection messages
 --blacklist   <txtfile>  perform circumvention tricks only to host names and subdomains from
                          supplied text file (HTTP Host/TLS SNI).
                          This option can be supplied multiple times.
 --allow-no-sni           perform circumvention if TLS SNI can't be detected with --blacklist enabled.
 --frag-by-sni            if SNI is detected in TLS packet, fragment the packet right before SNI value.
 --set-ttl     <value>    activate Fake Request Mode and send it with supplied TTL value.
                          DANGEROUS! May break websites in unexpected ways. Use with care (or --blacklist).
 --auto-ttl    [a1-a2-m]  activate Fake Request Mode, automatically detect TTL and decrease
                          it based on a distance. If the distance is shorter than a2, TTL is decreased
                          by a2. If it's longer, (a1; a2) scale is used with the distance as a weight.
                          If the resulting TTL is more than m(ax), set it to m.
                          Default (if set): --auto-ttl 1-4-10. Also sets --min-ttl 3.
                          DANGEROUS! May break websites in unexpected ways. Use with care (or --blacklist).
 --min-ttl     <value>    minimum TTL distance (128/64 - TTL) for which to send Fake Request
                          in --set-ttl and --auto-ttl modes.
 --wrong-chksum           activate Fake Request Mode and send it with incorrect TCP checksum.
                          May not work in a VM or with some routers, but is safer than set-ttl.
 --wrong-seq              activate Fake Request Mode and send it with TCP SEQ/ACK in the past.
 --native-frag            fragment (split) the packets by sending them in smaller packets, without
                          shrinking the Window Size. Works faster (does not slow down the connection)
                          and better.
 --reverse-frag           fragment (split) the packets just as --native-frag, but send them in the
                          reversed order. Works with the websites which could not handle segmented
                          HTTPS TLS ClientHello (because they receive the TCP flow "combined").
 --fake-from-hex <value>  Load fake packets for Fake Request Mode from HEX values (like 1234abcDEF).
                          This option can be supplied multiple times, in this case each fake packet
                          would be sent on every request in the command line argument order.
 --fake-with-sni <value>  Generate fake packets for Fake Request Mode with given SNI domain name.
                          The packets mimic Mozilla Firefox 130 TLS ClientHello packet
                          (with random generated fake SessionID, key shares and ECH grease).
                          Can be supplied multiple times for multiple fake packets.
 --fake-gen <value>       Generate random-filled fake packets for Fake Request Mode, value of them
                          (up to 30).
 --fake-resend <value>    Send each fake packet value number of times.
                          Default: 1 (send each packet once).
 --max-payload [value]    packets with TCP payload data more than [value] won't be processed.
                          Use this option to reduce CPU usage by skipping huge amount of data
                          (like file transfers) in already established sessions.
                          May skip some huge HTTP requests from being processed.
                          Default (if set): --max-payload 1200.


LEGACY modesets:
 -1          -p -r -s -f 2 -k 2 -n -e 2 (most compatible mode)
 -2          -p -r -s -f 2 -k 2 -n -e 40 (better speed for HTTPS yet still compatible)
 -3          -p -r -s -e 40 (better speed for HTTP and HTTPS)
 -4          -p -r -s (best speed)

Modern modesets (more stable, more compatible, faster):
 -5          -f 2 -e 2 --auto-ttl --reverse-frag --max-payload
 -6          -f 2 -e 2 --wrong-seq --reverse-frag --max-payload
 -7          -f 2 -e 2 --wrong-chksum --reverse-frag --max-payload
 -8          -f 2 -e 2 --wrong-seq --wrong-chksum --reverse-frag --max-payload
 -9          -f 2 -e 2 --wrong-seq --wrong-chksum --reverse-frag --max-payload -q (this is the default)

 Note: combination of --wrong-seq and --wrong-chksum generates two different fake packets.
How to check
To check if your ISP’s DPI could be circumvented, first make sure that your provider does not poison DNS answers by enabling «Secure DNS (DNS over HTTPS)» option in your browser.
- Chrome: Settings → Privacy and security → Use secure DNS → With: NextDNS
- Firefox: Settings → Network Settings → Enable DNS over HTTPS → Use provider: NextDNS
Then run the goodbyedpi.exe executable without any options. If it works — congratulations! You can use it as-is or configure further, for example by using --blacklist option if the list of blocked websites is known and available for your country.
If your provider intercepts DNS requests, you may want to use --dns-addr option to a public DNS resolver running on non-standard port (such as Yandex DNS 77.88.8.8:1253) or configure DNS over HTTPS/TLS using third-party applications.
Check the .cmd scripts and modify it according to your preference and network conditions.
How does it work
Passive DPI
Most Passive DPI send HTTP 302 Redirect if you try to access blocked website over HTTP and TCP Reset in case of HTTPS, faster than destination website. Packets sent by DPI usually have IP Identification field equal to 0x0000 or 0x0001, as seen with Russian providers. These packets, if they redirect you to another website (censorship page), are blocked by GoodbyeDPI.
Active DPI
Active DPI is more tricky to fool. Currently the software uses 7 methods to circumvent Active DPI:
- TCP-level fragmentation for first data packet
- TCP-level fragmentation for persistent (keep-alive) HTTP sessions
- Replacing
Hostheader withhoSt - Removing space between header name and value in
Hostheader - Adding additional space between HTTP Method (GET, POST etc) and URI
- Mixing case of Host header value
- Sending fake HTTP/HTTPS packets with low Time-To-Live value, incorrect checksum or incorrect TCP Sequence/Acknowledgement numbers to fool DPI and prevent delivering them to the destination
These methods should not break any website as they’re fully compatible with TCP and HTTP standards, yet it’s sufficient to prevent DPI data classification and to circumvent censorship. Additional space may break some websites, although it’s acceptable by HTTP/1.1 specification (see 19.3 Tolerant Applications).
The program loads WinDivert driver which uses Windows Filtering Platform to set filters and redirect packets to the userspace. It’s running as long as console window is visible and terminates when you close the window.
How to build from source
This project can be build using GNU Make and mingw. The only dependency is WinDivert.
To build x86 exe run:
make CPREFIX=i686-w64-mingw32- WINDIVERTHEADERS=/path/to/windivert/include WINDIVERTLIBS=/path/to/windivert/x86
And for x86_64:
make CPREFIX=x86_64-w64-mingw32- BIT64=1 WINDIVERTHEADERS=/path/to/windivert/include WINDIVERTLIBS=/path/to/windivert/amd64
How to install as Windows Service
Check examples in service_install_russia_blacklist.cmd, service_install_russia_blacklist_dnsredir.cmd and service_remove.cmd scripts.
Modify them according to your own needs.
Known issues
- Horribly outdated Windows 7 installations are not able to load WinDivert driver due to missing support for SHA256 digital signatures. Install KB3033929 x86/x64, or better, update the whole system using Windows Update.
- Intel/Qualcomm Killer network cards:
Advanced Stream Detectin Killer Control Center is incompatible with GoodbyeDPI, disable it. - QUIK trading software may interfere with GoodbyeDPI. First start QUIK, then GoodbyeDPI.
- Some SSL/TLS stacks unable to process fragmented ClientHello packets, and HTTPS websites won’t open. Bug: #4, #64. Fragmentation issues are fixed in v0.1.7.
- ESET Antivirus is incompatible with WinDivert driver #91. This is most probably antivirus bug, not WinDivert.
Similar projects
- zapret by @bol-van (for MacOS, Linux and Windows)
- Green Tunnel by @SadeghHayeri (for MacOS, Linux and Windows)
- DPI Tunnel CLI by @zhenyolka (for Linux and routers)
- DPI Tunnel for Android by @zhenyolka (for Android)
- PowerTunnel by @krlvm (for Windows, MacOS and Linux)
- PowerTunnel for Android by @krlvm (for Android)
- SpoofDPI by @xvzc (for macOS and Linux)
- SpoofDPI-Platform by @r3pr3ss10n (for Android, macOS, Windows)
- GhosTCP by @macronut (for Windows)
- ByeDPI for Linux/Windows + ByeDPIAndroid for Android (no root)
- youtubeUnblock by @Waujito (for OpenWRT/Entware routers and Linux)
Kudos
Thanks @basil00 for WinDivert. That’s the main part of this program.
Thanks for every BlockCheck contributor. It would be impossible to understand DPI behaviour without this utility.
We are reader supported and may earn a commission when you buy through links on our site. Read Disclosure
Networks are a tough thing to manage and monitor. It’s understandable, network traffic happens inside copper cabling or optical fibers and it can’t be seen. This makes it a bit complicated for any administrator to have a clear and definite picture of what is going on with the networks they manage. This is where network monitoring comes in. And when it comes to network monitoring, several levels of it are available, each providing more information about the traffic. Deep packet inspection is the top level of monitoring which provides the most information about network traffic. To perform deep packet inspection, you need proper tools — and today, we’re reviewing some of the best tools for deep packet inspection.
Before we start, we’ll try to explain deep packet inspection. It seems like everyone has a conflicting idea of what it is and what it should be. The deep packet inspection of interest to us today has to do with network monitoring, another vague term. To try to shed some light on the subject, we’ll discuss monitoring in general and flow analysis in particular as it constitutes a form of deep packet inspection. And since Cisco’s NetFlow technology seems to be the most prevalent, we’ll have a deeper look at it. Only then will we be ready to reveal what the best tools for deep packet inspection are and to offer you a brief review of each.
Deep Packet Inspection Explained
Deep packet inspection is defined as the act, for a network infrastructure component, of analyzing the content of data packets beyond simply looking at the packet header to gather statistics about network traffic or for filtering, prioritization or intrusion detection purposes. While this definition is relatively accurate, it is a bit generic. Furthermore, what deep packet inspection is can vary based on what you’re trying to accomplish. The deep packet inspection done for statistics gathering purposes, for instance, is different from deep packet inspection done for filtering out some traffic. In the context of this article, what we’re interested in is mostly statistics gathering. The tools we’ll be reviewing momentarily are essentially advanced monitoring tools.
About Monitoring Tools
Network monitoring, just like deep packet inspection, is not a clearly defined term. The most basic form of network monitoring is bandwidth monitoring. It’s typically done using the Simple Network Management Protocol. This type of monitoring is very useful to get a clear picture of your network’s utilization but it has limitations. While it will give you the average bandwidth utilization at a specific point of the network, it won’t provide details as to what is using up the bandwidth.
For a clearer picture of what traffic is transported on a network, you need to use flow analysis. Flow analysis goes way deeper than bandwidth monitoring and can provide detailed information. It relies on the networking devices themselves to send traffic information to monitoring systems called collectors and/or analyzers which can interpret flow data and present it in meaningful ways. Flow analysis will, for example, let you view how network traffic is distributed among all the sources and destination. It will tell you about what protocols and what types of traffic are used.
Flow analysis can be considered as deep packet inspection in that it goes beyond just looking at the header to find qualitative information about the actual data that is being transported on a network. The most common of all flow analysis technologies is certainly Cisco’s NetFlow. Let’s have a deeper look at it.
More About NetFlow
NetFlow was originally developed by Cisco Systems and introduced on their routers with the goal of providing the ability to collect IP network traffic information as it enters or exits an interface. Its original intent was to be used to build better Access Control Lists (ACL). It has since expanded into a true monitoring scheme and the flow data collected by devices is now exported dia.
The NetFlow technology is comprised of essentially three components. The first one is the flow exporter which aggregates packets into flows and exports flow records towards one or more flow collectors. The next component, the flow collector, is responsible for the reception, storage and pre-processing of the flow data received from the previous component. Finally, the flow analyzer is used to analyze the received flow data. This analysis can be used for traffic profiling or network troubleshooting, among other uses. Many modern setups combine the flow collector and analyzer into a single, integrated component.
How NetFlow Works
Any other device that supports NetFlow can be configured to output flow data in the form of flow records and send them to a NetFlow collector. A flow is a complete conversation in the IP sense. And there could be many flows going through one interface at any given time. The networking device preparing flow records sends them to the collector when it determines, either through aging or seeing a TCP session termination, that the flow has finished.
A typical flow record packs quite a bit of information. This includes the input and output interfaces, the start and finish time stamps of the flow, the number of bytes and packets it contains, the layer 3 headers, the source and destination IP address and port number, the IP protocol, and the TOS (Type Of Service) value. Flow records don’t contain the actual data that made up the flow. They only contain information about the flow. This is important from a security standpoint.
In most environments, the flow collectors where the records are sent are often also the flow analyzers. Only very large, multi-site networks will benefit from having separate collectors distributed throughout the various sites. The collectors and analyzers use the information contained in flow records to present data about network traffic in a way that is useful to network administrators. In fact, the main distinguishing factors between the different tools is the way they can make sense of and present data in a meaningful way.
From a monitoring standpoint, flow analysis is a form deep packet inspection so the tools we’re reviewing today are indeed NetFlow analyzers. Many of them will do more than that, though and some are part of a complete monitoring solution.
1. SolarWinds NetFlow Traffic Analyzer (FREE Trial)
SolarWinds, in the improbable case that you’ve never heard of the company, makes some of the best software for network and system administration. One of its flagship product, the SolarWinds Network Performance Monitor, is considered by many to be one of the best network bandwidth monitoring tool. And SolarWinds also makes some excellent free tools, each addressing a specific task of network administrators. Two examples of those free tools are a free advanced subnet calculator and a free syslog server. And when it comes to NetFlow traffic analysis, the SolarWinds NetFlow Traffic Analyzer (NTA) is definitely one of the best NetFlow collector and Analyzer you can find.
Among the product’s best features, the SolarWinds NetFlow Traffic Analyzer can monitor Bandwidth use by application, protocol, and IP address group. It can not only monitor Cisco NetFlow but also Juniper J-Flow, sFlow, Huawei NetStream, and IPFIX—a few other flow analysis technologies based on NetFlow—to identify which applications and protocols are the top bandwidth consumers. The tool collects traffic data, correlates it into a usable format, and presents it to the user on a web-based dashboard. The product supports Cisco NBAR2 to identify which applications and categories consume the most bandwidth, giving you an even better network traffic visibility.
The SolarWinds NetFlow Traffic Analyzer is an add-on to the Network Performance Monitor (NPM). If you don’t already own an NPM license, you’ll have to factor it that cost. They start at $2 955 for up to 100 elements. As for the NTA add-on, its license must match the number of nodes of your NPN license and prices start at $1 915. If you’d rather try the product before committing to a purchase, a free trial is available from SolarWinds.
2. SolarWinds Real-Time NetFlow Analyzer (Free Download)
If you need a smaller-scale solution the SolarWinds Real-Time NetFlow Analyzer might be just what you need. This is one of SolarWind’s famous free tools and, although not quite as complete as the NetFlow Traffic Analyzer, it gives you some of the same basic functionality.
It can capture and analyze flow data in real time. And it will show you the type of traffic transported on your network, where it’s is coming from, and where it’s going to. You can also use it—to a certain extent—to diagnose traffic spikes and troubleshoot bandwidth issues.
The product will let you identify which users, devices, and applications are consuming the most bandwidth; isolate network traffic by conversation, app, domain, endpoint, and protocol; and view network traffic by type and specified time periods
Of course, you can’t expect this free software to do everything its big brother does. It has some severe limitations and its primary focus is the current and very recent state of your network. It will only collect data from one NetFlow interface and will only keep and analyze the last 60 minutes of data.
If you need a quick and dirty view of your bandwidth usage, the SolarWinds free Real-Time NetFlow Analyzer will provide it but not much more.
3. ManageEngine NetFlow Analyzer
ManageEngine is another well-known name in the field of network management tools. Its ManageEngine NetFlow Analyzer gives network administrators a detailed view of network bandwidth utilization as well as traffic patterns. The product is controlled by a web-based interface and offers an impressive number of different views on your network.
For example, the product will let you view traffic by application, by conversation, by protocol, and several more options. You also have the possibility of setting alerts to warn you of potential issues. You could, for instance, set a traffic threshold on a specific interface and be alerted whenever it is exceeded.
But the biggest strengths of this tool are its reports and dashboard. It does come with several very useful pre-built reports that are custom-tailored for specific purposes such as troubleshooting, capacity planning or billing. And as good as its built-in reports are, the tool also allows administrators to create custom reports to their liking.
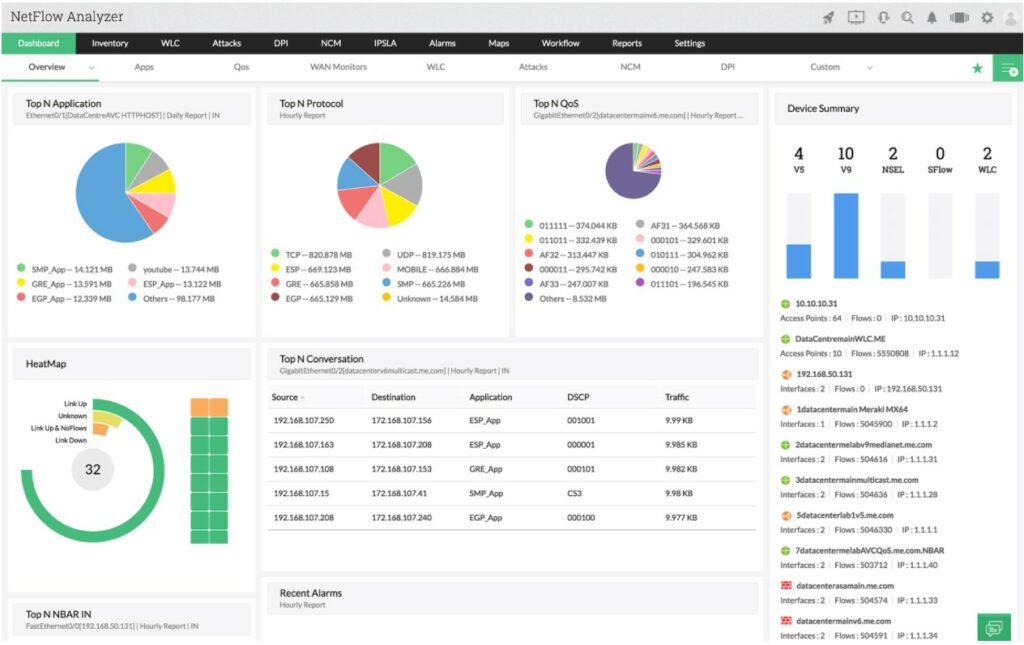
The product’s dashboard is just as impressive as its reports. It includes several pie charts with things such as top applications, top protocols or top conversations. It can also display a sort of heat map with the status of the monitored interfaces. And just like the reports, the dashboard can also be customized to include only the information you find useful. The dashboard is also where alerts are displayed in the form of pop-ups. On-the-go network administrator won’t feel left out as a smartphone app is available and it will give you access to both the dashboard and reports.
The ManageEngine NetFlow Analyzer supports most flow technologies including NetFlow, IPFIX, J-flow, NetStream, and a few others. This tool also boasts an excellent integration with Cisco devices, with the possibility of adjusting traffic shaping and/or QoS policies right from within the tool.
The ManageEngine NetFlow Analyzer comes in two versions. There’s a free version that is limited to monitoring only two interfaces of flows. While this is not much, it could be all that you need. And that free version will allow unlimited devices for the first 30 days, giving you a chance to give a thorough test run. Once the trial is over, licenses are available in several sizes from 100 to 2500 interfaces or flows with prices starting at about $600 plus annual maintenance fees.
4. Paessler Router Traffic Grapher (PRTG)
PRTG from Paessler is another well-known, all-in-one solution whose primary purpose is monitoring bandwidth utilization. It’s also used to monitor the availability and health of different network resources. As such, it’s another very useful tool for network administrators. But thanks to a NetFlow sensor that is available for the product, PRTG can also serve as a NetFlow collector and analyzer.
In fact, PRTG is not just a bandwidth monitoring tool or a NetFlow collector and analyzer. It uses several technologies to monitor systems, devices, traffic, and applications. Among them the product will use SNMP with ready to use and custom options, WMI and Windows performance counters, SSH for Linux/Unix and MacOS systems, flows—such as NetFlow or sFlow—and packet sniffing, HTTP requests, REST APIs returning XML or JSON, Ping, SQL and many more.
Installing PRTG is easy. You simply run the installer, then the auto-discovery process will discover devices and set up sensors. You are then free to add additional sensors—such as NetFlow collectors—manually. There’s even a detailed video on Paessler’s website that will show you how it’s done.
The server runs on Windows only but its user interface is web-based and can be accessed from any browser. There’s also a mobile client app that you can install on your smartphone. The mobile client app has a unique feature in the form of QR labels that you can print and affix on your devices. Then, a scan of the code from the mobile app will quickly open that device’s sensor data.
Two versions of PRTG are available. There’s a free version which is limited to 100 sensors. Be aware that a sensor in PRTG parlance is not a device. It is, instead, the most basic element that can be monitored. For example, monitoring each port of a 48-port switch requires 48 sensors and NetFlow collection and analysis requires one sensor per flow exporter. At that pace, it’s obvious that 100 sensors might not be as much as it first appeared. If you need more than 100 sensors, you’ll need to purchase a license. They are available in 500, 1000, 2500, or 5000 sensors and there’s also an unlimited license. Prices vary from around $1 600 to just under $15 000. The free version will allow unlimited sensors for the first 30 days so you can benefit from a thorough test-drive of the product.
5. Scrutinizer
Last on our list is Scrutinizer from Plixer, another excellent NetFlow Analyzer. It is actually much more than that and some view it as a full incident response system. The product has the ability to monitor different flow types such as NetFlow, J-flow, NetStream, and IPFIX so you’re not limited to monitoring only Cisco devices.
Scrutinizer boasts a hierarchical design which offers streamlined and efficient data collection and allows you to start small and then scale way up to many million flows per second. The network is often first blamed whenever something goes wrong, With this tool, you can quickly find the real cause of almost every network issues. The product works with both physical and virtual environments and comes with advanced reporting features.
Scrutinizer is available in four license tiers. They range from the basic free version to the full-fledged SCR level which can scale up to over 10 million flows per second. The free version is limited to 10 thousand flows per second and it will only keep raw flow data for 5 hours but it should be more than enough to troubleshoot network issues. You can also try any license tier for 30 days after which it will revert back to the free version.
If routing can be compared to the post-mailing system, then Deep Packet Inspection “DPI” should be equal to Airport Security. Today we’re going to take a dive into the Best Deep Packet Inspection Software and Tools of 2025 and jump into a short tutorial and Guide.
Just like a postman that looks at the package recipient label— the job of a networking device (or router) is only to look at the header of the IP packet, look at the destination address, make a decision, and route as fast as possible.
Here is our list of the top packet analysis tools:
- ManageEngine NetFlow Analyzer – FREE TRIAL This package provides a range of methods to examine and record packet details including flow protocols and DPI. Runs on Windows Server, Linux, and AWS. Download the 30-day free trial.
- Site24x7 – FREE TRIAL This cloud-hosted platform connects to a LAN and implements protocol analysis, which involves reading the headers of packet on the network. Start a 30-day free trial.
- Paessler Packet Sniffing with PRTG This module doesn’t collect packets but generates statistics from their headers, Available as a SaaS package or for installation on Windows Server.
- ManageEngine NetFlow Analyzer This package provides a range of methods to examine and record packet details including flow protocols and DPI. Runs on Windows Server, Linux, and AWS.
- nDPI with ntopng This package is based on OpenDPI and it will analyze packets that are being processed by ntopng. Available for Windows, macOS, and Linux.
- Netifyd This adaptation of nDPI is designed as a collector that you can use to feed packet header data into analytical systems. Available for Linux, BRD, and network device OSs.
Looking at just one portion of the packet makes routing much more efficient and fast. But in the post-mailing system, a mail carrier cannot open the package to inspect its contents.
You can leave this to the Transportation Security Airport “TSA.” They are the ones with the technology, resources, and permission to check every single passenger, bag, and package.
In the networking space, a router can do a lot more than just checking the destination address. With the DPI technology, a router can look deep into the contents of the package and make decisions accordingly.
What is DPI and How it Works?
Deep Packet Inspection “DPI” is a sophisticated method to examine the contents of network traffic. It can filter packets based on in-depth analysis at all layers of the OSI model.
As mentioned before, a router would typically only look at the IP header of a packet. In the case of a stateless firewall (also known as an ACL “Access Control List”), it would only check connections based on source and destination IP addresses.
To help clarify this, use the picture below. An L3 router or stateless firewall would only work in the Network layer and below.
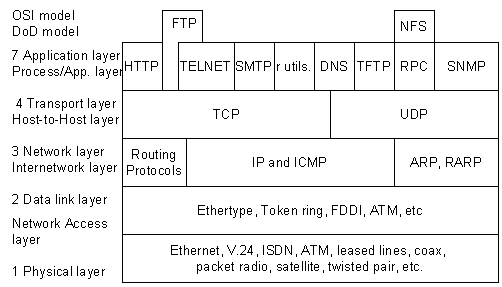
But routing and firewalling methods are evolving over the years. The firewall technology had to evolve and adapt the “shallow packet inspection technology” to protect the network from the increasing variation of attacks.
In the same case, to route based on the transport layer, the L4 switch was born. The stateful firewall would watch the traffic from end to end, by digging “shallowly” into the TCP/UDP connection.
In other words, a stateful firewall performs a superficial inspection to the transport layer and can identify the using ports whether is HTTP, SMTP, SNMP, DNS, etc.
Reverse Engineering DPI
To understand shallow/deep inspection, you need to know how a network package is encapsulated. Refer to the picture below. An application, such as DropBox, Skype, or BitTorrent creates data.
This data is encapsulated in the Transport layer into a TCP segment with a UDP/TCP header. The segment is then encapsulated into an IP datagram on the Internet layer, with an IP header. Finally, it is turned into a datagram in the layer 2 with a frame header and sent over to the physical media.
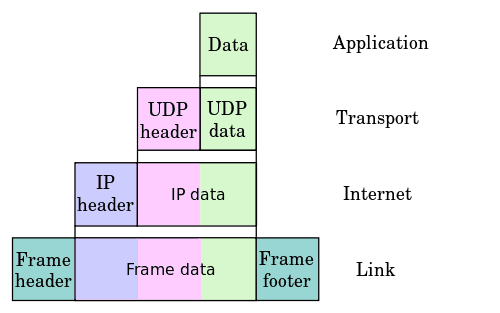
A stateful firewall can find out which application protocol was used by looking into the TCP segment of the transport layer, but it is not able to see the data itself.
DPI technology takes a step forward.
It can open the packet and look through Layer 2-7 of the OSI model. In other words, the DPI technology can look into:
- Layer 2 frames.
- Layer 3 IP headers.
- Data protocol structures
- But most importantly, the Payload of the message
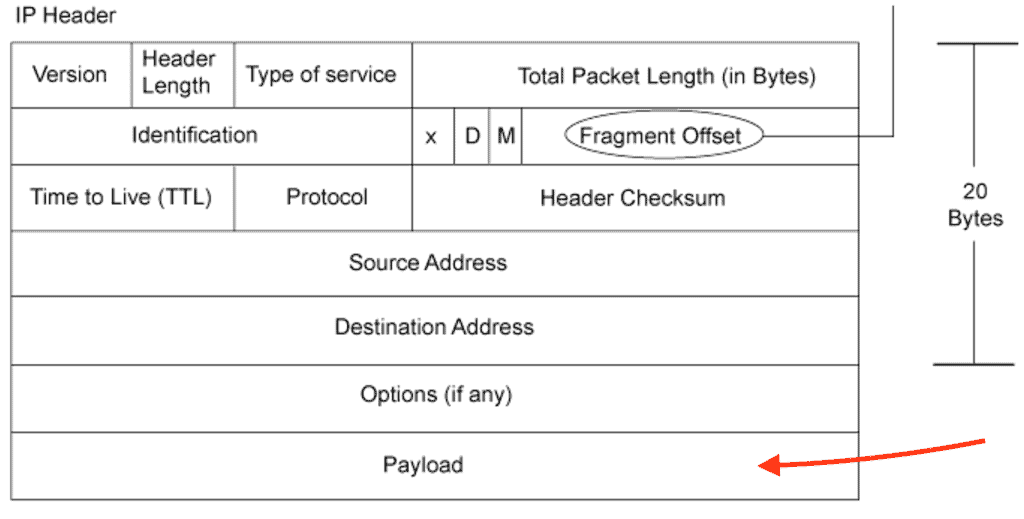
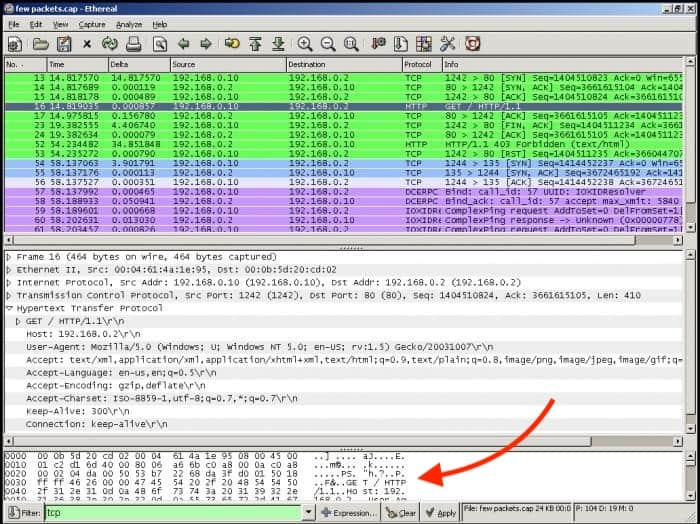
The payload is the actual data that is not supposed to be discarded or opened until it reaches the final destination. If you capture traffic flow and open a single packet from the specific source/destination in Wireshark, you could open it and view its payload (just like DPI would).
The problem here is that the results are too verbose. To make some sense out of this, you might need to do a lot of conversions on Hexadecimal to Decimal; it would be too time-consuming for only one packet.
A DPI-enabled router or firewall has access to all information in the payload and uses libraries to make sense out of this data. A device with DPI can be configured with policies and can make decisions based on layer 7 data, and block, re-route or keep logs of the traffic.
What’s The Importance of DPI?
DPI is so important because it can help large corporations improve their security standpoint by shaping its traffic. But not every router (or firewall) can handle deep packet inspection. The technology requires substantial resources to work, so it is not common in SMBs (Small-to-Medium-Businesses), and if not configured correctly, it can be a real traffic bottleneck.
A router with DPI needs to be powerful to be able to open every packet, inspect it, wrap it, and send it again. Only large enterprises, governments, and telecom service providers have the resources to put this technology to work.
DPI can is used in a Wide Variety of Applications.
It can help a corporation guarantee that the data sent and received does not contain malicious code and detect advanced cyber-attacks. On the other hand, DPI can also be used for other motives, such as eavesdropping, re-directing, or block specific traffic.
An example of DPI in action is when an ISP wants to shape the traffic. If there is traffic that is too demanding on their networks, such as streaming media or torrents, they might want to open such packets and shape the traffic accordingly.
ISPs might also use it to drop packets coming from specific websites, such as competitors, adult content, piracy, etc.
IPS/IDS Systems Using DPI Analysis
An Intrusion Detection System “IDS” is capable of detecting intrusions, but it cannot block an attack.
An IDS can employ Deep Packet Intrusion technology to help it:
- Collect more information on the attack.
- Identify some attack signatures and patterns.
- Controls network traffic such as FTP root access, Telnet, or specific HTTP content.
IDS that rely on DPI can inspect the content of packets and get more information. With this technology, an IDS can identify an attack faster and even control it. The IDS compares the attack to a database to match it against attacks signatures and lets DPI act according to its policies.
On the other hand, an Intrusion Detection Systems “IPS” can detect and block attacks in real-time. Some “IPS” solutions also implement DPI technologies to help prevent attacks. It can:
- Prevent certain attacks signatures.
- Protect against certain vulnerabilities and exploits.
In most cases, a DPI can improve the security standpoint of conventional solutions.
DPI incorporates the capabilities of IDS/IPS with a traditional stateful firewall, making it capable of finding attack variations that these devices cannot identify by themselves.
DPI usually comes as a feature in security appliances or as a virtual DPI deployed in a server.
Although a proper implementation is to employ a dedicated security/DPI appliance, you might also want to implement DPI as a service or through software.
Below you’ll find a quick description of each product as well as some screenshots and where to download them to test them out!
Our methodology for selecting Deep Packet Inspection (DPI) tool:
We’ve broken down our analysis for you based on these key criteria:
- Capability to analyze network traffic in-depth.
- Support for multiple protocols and analysis methods.
- User interface and ease of use.
- Pricing and availability of a free trial or free version.
- Ability to integrate with other network monitoring tools.
1. ManageEngine NetFlow Analyzer – FREE TRIAL
ManageEngine NetFlow Analyzer gets its name from the NetFlow protocol, which is a network device activity recording system that was invented by Cisco. This tool can get that data out of devices. The package also provides the Network Packet Sensor, which gives you the option to read packet headers and collate statistics.
Key Features:
- NetFlow, sFlow, J-Flow, IPFIX, AppFlow, and Netstream
- Protocol analysis
- Multiple analysis methods
Why do we recommend it?
ManageEngine NetFlow Analyzer stands out for its ability to support various flow protocols, coupled with efficient data management, making it ideal for in-depth network analysis.
The DPI feature of the Network Packet Sensor is also able to read the data payload of packets. However, much of your traffic will contain encrypted data, so don’t expect to be able to read those contents. You will certainly be able to see header data, which gives you protocol analysis.
This system doesn’t store packets like Wireshark, so it doesn’t build up massive files on your disks. This is an efficient analysis method because you get all of the essential information without vast amount of data storage. The package will show time-series graphs and analyze traffic by protocol/application, source, and destination.
Who is it recommended for?
This tool is highly recommended for network administrators and IT professionals who require detailed traffic analysis without the data storage burden, especially in environments where multiple protocols are in use.
Pros:
- A choice of flow protocols or DPI for traffic sourcing traffic statistics
- Time-series live activity graphs
- Historical analysis
There are four editions for ManageEngine NetFlow Analyzer and here are their base prices:
- Free: $0 – restricted to monitoring two interfaces
- Standard: $8,595 – for 500 interfaces
- Professional: $595 – 10 interfaces
- Enterprise: $1,045 – 10 interfaces
You can get a 30-day free trial from this package that runs on Windows Server and Linux. You also get a free trial with the version that is available on AWS Marketplace.
EDITOR’S CHOICE
ManageEngine NetFlow Analyzer is our top network monitor because it offers a comprehensive set of features suitable for detailed network traffic analysis. It supports various flow protocols and integrates DPI for in-depth traffic sourcing, making it versatile for different network environments. The tool is efficient in data handling, providing essential information without requiring large storage space. It’s especially beneficial for those seeking detailed traffic analysis without the complexity of storing massive data files. Plus, its free trial on Windows Server and Linux makes it accessible to a broad range of users.
Download: Get a 30-day free trial
Official Site: https://www.manageengine.com/products/netflow/download.html
OS: Windows Server, Linux
2. Site24x7 – FREE TRIAL

Site24x7 uses flow protocols to sample packet header data. Most of the deep packet inspection takes place within your switches and is a built-in function. Rather than repeating this work, Site24x7 simply accesses the protocol-level statistics that switches typically compile.
Key Features:
- Network discovery
- Protocol analysis
- Netflow, sFlow, IPFIX, J-Flow, and others
- Network topology mapping
Why do we recommend it?
Packet capture tools can quickly generate very large files that are difficult to scan through, Site24x7 doesn’t fill up your servers – it just copies the packet header statistics that your switches are already compiling. Hopefully, all of your traffic is encrypted, so unless you get a tool that offloads encryption to the network gateway, you won’t be able to read the data payload anyway.
Unfortunately, many network device producers created their own statistics protocols, starting with NetFlow, which was defined by Cisco Systems. This means that if you buy switches and routers from different vendors – looking for the best deal with each purchase – you would end up with many different flow protocols operating on your network. Because of this, you need a traffic analyzer that covers as many of these protocols as possible and Site24x7 is capable in every flow protocol known to man.
Who is it recommended for?
At some point, every person in charge of a network is going to need to assess traffic patterns. In this case, a packet capture tool, such as Wireshark, can be overwhelming. So, the summaries and segmented statistics offered by Site24x7 are a welcome source of data for any capacity planning or network layout design exercise.
Pros:
- Live traffic data
- Capacity planning support
- Insights into network layout errors
- Opportunities for traffic shaping
Cons:
- Doesn’t directly inspect packets
The plans for Site24x7 are accessible for all sizes of businesses. The advertised prices are very low but this is because the base packages in each plan have very little capacity. Larger companies are catered for but at higher prices. For example, the advertised price for the Infrastructure Monitoring edition is $9 per month but very few subscribers will actually get that low price.
The Site24x7 30-day free trial gives access to all facilities on the cloud platform of system monitoring and management tools.
Site24x7
Download a 30-day FREE Trial
3. Paessler Packet Sniffing with PRTG
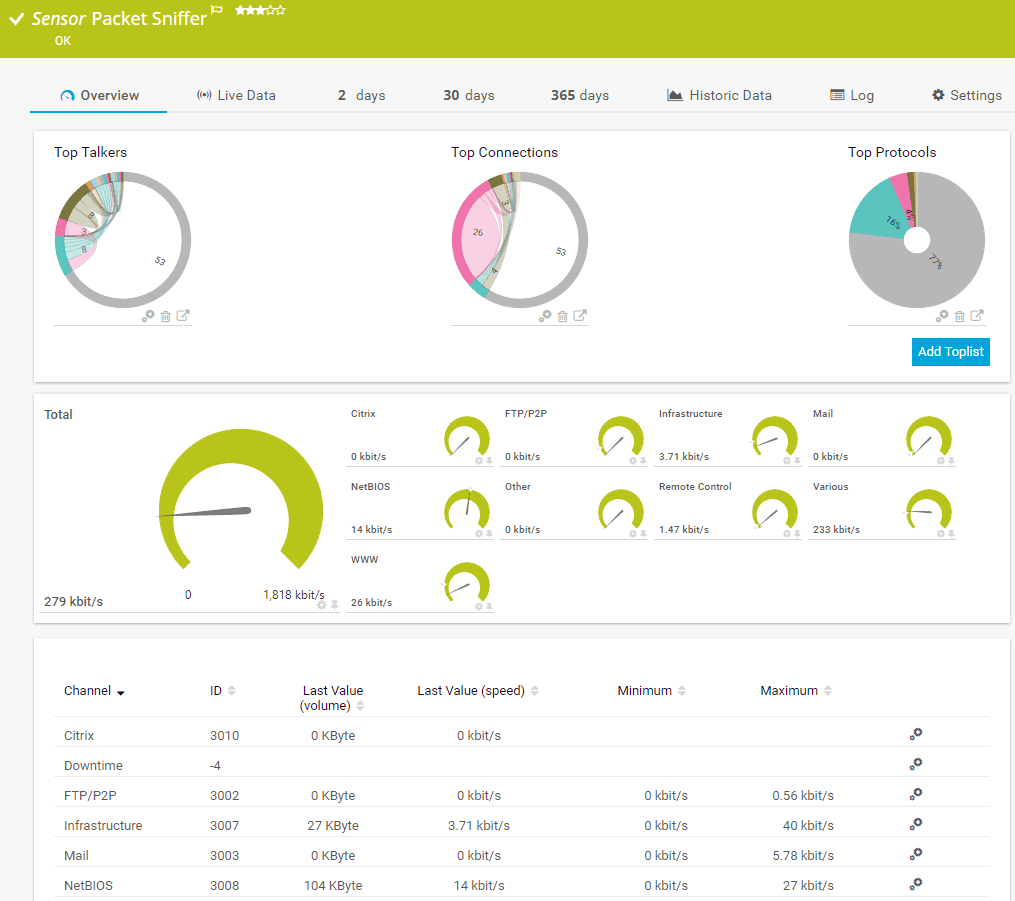
A packet sniffer analyzes network traffic similar to DPI. PRTG employs a packet sniffer sensor to capture every packet that is transmitted on the network and digs deep into its content.
Key Features:
- Packet header statistics.
- Diverse technology integration.
- Free version available.
- On-premises or SaaS options.
Why do we recommend it?
PRTG’s strength lies in its multi-technology approach, combining packet sniffing with SNMP and WMI for comprehensive network performance reporting.
To achieve this, PRTG uses different technology, such as SNMP, Netflow, WMI, REST APIs, and packet sniffing. Network admins use PRTG mainly for troubleshooting network problems or collecting detailed statistics. Just like DPI, it can also help identify bandwidth consumption trends, for example, a File Sync or Cloud App that is consuming too much bandwidth.
PRTG’s packet sniffer can also help improve the security standpoint, by identifying different types of traffic, such as P2P or possible attacks.
Who is it recommended for?
Ideal for network admins seeking a versatile tool for troubleshooting, security enhancement, and bandwidth consumption analysis, PRTG’s diverse technology integration makes it a robust choice.
Pros:
- Uses a combination of packet sniffing, WMI, and SNMP to report network performance as well as discover new devices
- Autodiscovery reflects the latest inventory changes almost instantaneously
- Drag and drop editor makes it easy to build custom views and reports
- Supports a wide range of alert mediums such as SMS, email, and third-party integration
- Supports a freeware version
Cons:
- Is a very comprehensive platform with many features and moving parts that require time to learn
With PRTG you can choose a license based on sensors. To give you an idea of the pricing and their predefined packages of sensors: PRTG500 (500 sensors for $1365.00), PRTG2500 ( 2500 sensors for $5100), PRTG XL1 (Unlimited sensors for $11,500). An unlimited version of PRTG for 30 days.
4. nDPI with NTopng
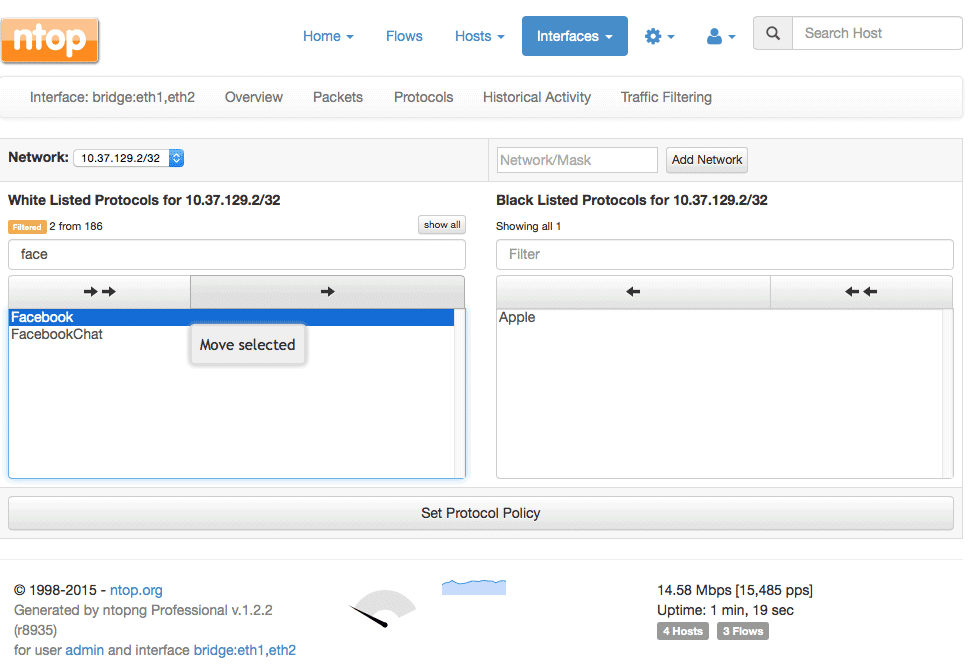
NTop is a network monitoring suite. It has a variety of products for Packet Capture, Traffic Recording, Network Probe, Traffic Analysis, and DPI. DPI from NTop is performed by nDPI with the help of NTopng. nDPI is an open source and extensible DPI library, based on the popular OpenDPI.
Key Features:
- NTopng integration.
- Open-source and free.
- Based on OpenDPI.
Why do we recommend it?
nDPI with NTopng is recommended for its open-source nature and integration with NTopng, providing a cost-effective solution for traffic analysis and policy application.
A network admin can use this tool to block specific traffic flows, hosts, or network protocols. But since nDPI is only a library, it must be used with other apps such as ntopng and nProbe cento to perform the rules.
NTopng is the web interface monitoring tool that can passively collect traffic from a network interface to show status and performance. With ntopng and ndpi you can apply L7 policies, such as shaping the traffic of specific applications within a network subnet.
Who is it recommended for?
Network administrators who prefer open-source solutions and need a tool to apply Layer 7 policies effectively will find nDPI with NTopng particularly useful.
Pros:
- Open-source project with full transparency
- Free version available alongside the enterprise version
- Special licensing options for nonprofits and educational institutions
Cons:
- User interface is easy to use, but could be improved upon
It is a free and open source software. Find the source code, here.
5. Netifyd
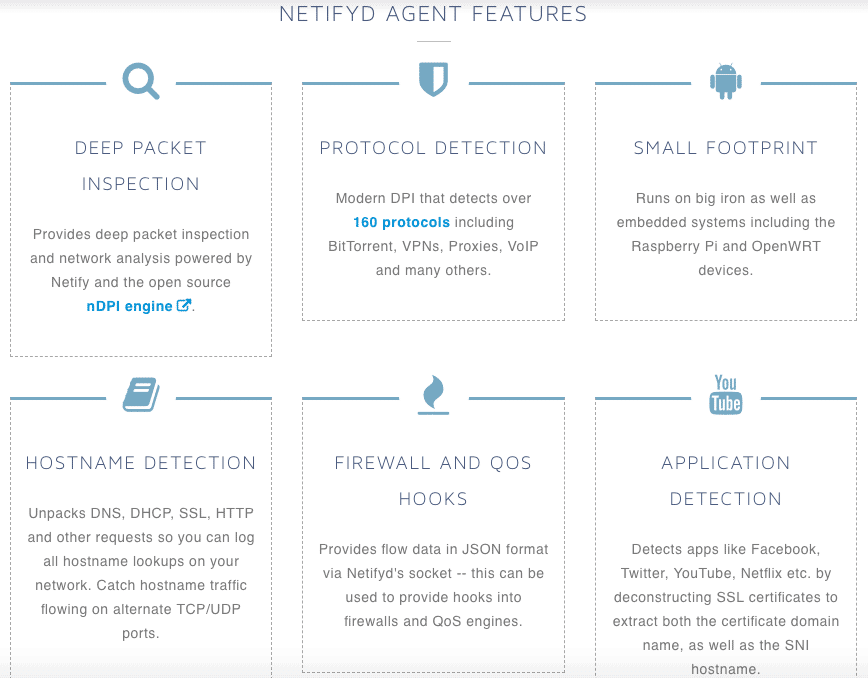
The Netify Agent or Netifyd is a DPI engine based on the open source nDPI. The software is capable of categorizing traffic patterns and identifying protocols such as Skype, P2P, Plex Media Server, etc.
Key Features:
- Open-source nDPI based.
- Free with paid options.
- Effective metadata extraction.
Why do we recommend it?
Netifyd is recommended for its ability to categorize traffic patterns efficiently and its flexibility in offering both free and paid extensions.
Netifyd empowers from the DPI technology to open packets on the application layer, look at HTTPS certificates and detect websites/apps such as Youtube, Facebook, Netflix, etc. Netifyd captures traffic passively which means that it does not blocks, filters, or manipulates traffic.
Netifyd just provides DPI services to other tools. These traffic packets are then scanned through the nDPI protocol to detect packet flows.
Who is it recommended for?
This tool is suitable for network administrators in smaller network deployments who need a minimalistic, yet effective DPI solution.
Pros:
- Transparent open-source project
- The dashboard is minimalistic and good for smaller network deployments
- Paid version if affordable, even for smaller labs
Cons:
- Another fork of OpenDPI can be a con if you’re not a fan of that framework
- No packet analysis functionality
- Only supports application layer scanning
The pricing of Netify is based on three models, Basic ($50 /per agent per month), Pro ($100 /per agent per month), and Flex (contact them). Get the 15-day trial of Netify for free.
Conclusion, What’s Next?
DPI can help improve a network security standpoint, by enhancing the functionalities of firewalls, IDS, and IPS. It can also shape the traffic to solve problems faster and improve bandwidth consumption.
Some DPI solutions can also develop the limitations of IDS/IPS. Some of these services that rely on DPI offer additional functionalities such as, malware analysis, anti-spam filtering, buffer overflow, DoS attack prevention, VPNs, URL filtering, etc.
But DIP is a high resource consumption technology, so it is reserved for large enterprises, ISPs, and even governments. It has always been state-of-the-art network management and now it is used in different scenarios other than security and routing.
It is helping companies with Internet data mining, block traffic to competition, eavesdropping, and even Internet censorship. If you have a powerful server or want to test the DPI functionality on a small scale, download one of the tools shown above and give them a try!
Deep Packet Inspection FAQs
What is deep packet inspection?
Deep packet inspection (DPI) is a technology used to examine the contents of network traffic at a granular level. It allows for the analysis of individual packets of data, enabling the detection of specific protocols, applications, and content.
How does deep packet inspection work?
Deep packet inspection works by intercepting and analyzing network traffic in real-time. It looks beyond the basic header information of network packets to examine the payload contents. This enables the identification of specific protocols, applications, and content.
What are some common applications of deep packet inspection?
Common applications of deep packet inspection include network security, traffic analysis and optimization, and compliance monitoring. It is also used in network forensics, intrusion detection, and content filtering.
What are some benefits of deep packet inspection?
Some benefits of deep packet inspection include improved network security and threat detection, enhanced network performance and optimization, and better compliance monitoring and reporting. It can also help identify network issues and inefficiencies, enabling proactive network management and troubleshooting.
What are some potential risks or drawbacks of deep packet inspection?
One potential risk of deep packet inspection is the potential for invasion of privacy. The technology enables the examination of individual packets of data, which can include sensitive information such as personal data, login credentials, or confidential business information. There are also concerns around the potential misuse of deep packet inspection for surveillance or other nefarious purposes.
How is deep packet inspection different from other network monitoring technologies?
Deep packet inspection is different from other network monitoring technologies, such as network flow analysis or packet capture, because it provides more detailed information on the contents of network traffic. It enables the identification of specific protocols, applications, and content, enabling more granular analysis of network behavior and performance. This can be especially useful in identifying and mitigating security threats and optimizing network performance.
Время на прочтение5 мин
Количество просмотров19K
В данной статье не рассматривается полная настройка DPI и все вместе связанное, а научная ценность текста минимальна. Но в ней описывается простейший способ обхода DPI, который не учли многие компании.

Предупреждение №1: данная статья несет исследовательских характер, не побуждает никого что-либо предпринимать и использовать. Идея основана на личном опыте, а любые совпадения случайны.
Предупреждение №2: в статье не раскрываются тайны Атлантиды, поиска Святого Грааля и иные загадки вселенной, весь материал находится в свободном доступе и возможно не раз был описан на Хабре. (я не нашел, за ссылку буду признателен)
Для тех, кто прочитал предупреждения начнем.
Что такое DPI?
DPI или Deep Packet Inspection — технология накопления статистических данных, проверки и фильтрации сетевых пакетов анализируя не только заголовки пакетов, но и полное содержимое трафика на уровнях модели OSI со второго и выше, что позволяет обнаруживать и блокировать вирусы, фильтровать информацию, не удовлетворяющую заданным критериям.
Существует два типа подключения DPI, которые описаны ValdikSS на github:
Пассивный DPI
DPI, подключенный в провайдерскую сеть параллельно (не в разрез) либо через пассивный оптический сплиттер, либо с использованием зеркалирования исходящего от пользователей трафика. Такое подключение не замедляет скорость работы сети провайдера в случае недостаточной производительности DPI, из-за чего применяется у крупных провайдеров. DPI с таким типом подключения технически может только выявлять попытку запроса запрещенного контента, но не пресекать ее. Чтобы обойти это ограничение и заблокировать доступ на запрещенный сайт, DPI отправляет пользователю, запрашивающему заблокированный URL, специально сформированный HTTP-пакет с перенаправлением на страницу-заглушку провайдера, словно такой ответ прислал сам запрашиваемый ресурс (подделывается IP-адрес отправителя и TCP sequence). Из-за того, что DPI физически расположен ближе к пользователю, чем запрашиваемый сайт, подделанный ответ доходит до устройства пользователя быстрее, чем настоящий ответ от сайта.
Активный DPI
Активный DPI — DPI, подключенный в сеть провайдера привычным образом, как и любое другое сетевое устройство. Провайдер настраивает маршрутизацию так, чтобы DPI получал трафик от пользователей к заблокированным IP-адресам или доменам, а DPI уже принимает решение о пропуске или блокировке трафика. Активный DPI может проверять как исходящий, так и входящий трафик, однако, если провайдер применяет DPI только для блокирования сайтов из реестра, чаще всего его настраивают на проверку только исходящего трафика.
От типа подключения зависит не только эффективность блокирования трафика, но и нагрузка на DPI, поэтому существует возможность не проверять весь трафик, а только определенный:
«Обычный» DPI
Под «обычным» DPI понимается такой DPI, который фильтрует определенный тип трафика только на самых распространенных портах для этого типа. Например, «обычный» DPI выявляет и блокирует запрещенный HTTP-трафик только на порту 80, HTTPS-трафик на порту 443. Данный тип DPI не будет отслеживать запрещенный контент, если вы отправите запрос с заблокированным URL на незаблокированный IP или нестандартный порт.
«Полный» DPI
В отличие от «обычного» DPI, данный тип DPI классифицирует трафик вне зависимости от IP-адреса и порта. Таким образом, заблокированные сайты не будут открываться, даже если вы используете прокси-сервер на совершенно другом порту и незаблокированном IP-адресе.
Использование DPI
Чтобы не снижать скорость передачи данных требуется использовать «Обычный» пассивный DPI, который позволяет эффективно? блокировать любые? ресурсы, по умолчанию конфигурация выглядит так:
- HTTP фильтровать только на 80 порту
- HTTPS только на 443 порту
- BitTorrent только на 6881-6889 портах
Но проблемы начинаются, если ресурс будет использовать другой порт, чтобы не терять пользователей, тогда придется проверять каждый пакет, для примера можно привести:
- HTTP работает на 80 и 8080 порту
- HTTPS на 443 и 8443 порту
- BitTorrent на любом другом диапазоне
Из-за этого придется либо перейти на «Активный» DPI, либо использовать блокирование с помощью дополнительного DNS-сервера.
Блокирование с помощью DNS
Одним из способов заблокировать доступ к ресурсу является перехват DNS-запроса с помощью локального DNS-сервера и возвращение пользователю IP-адреса “заглушки”, а не требуемого ресурса. Но это не дает гарантированный результат, так как существует возможность предотвратить подмену адреса:
Вариант 1: Редактирование файла hosts (для десктопа)
Файл hosts является неотъемлемой частью любой операционной системы, что позволяет всегда использовать его. Для доступа к ресурсу пользователю надо:
- Узнать IP-адрес требуемого ресурса
- Открыть на редактирование файл hosts (требуются права администратора), расположенный в:
- Linux: /etc/hosts
- Windows: %WinDir%\System32\drivers\etc\hosts
- Добавить строку в формате: <ip-адрес> <имя ресурса>
- Сохранить изменения
Преимущество данного метода — его сложность и требования наличие прав администратора.
Вариант 2: DoH (DNS over HTTPS) или DoT (DNS over TLS)
Данные методы позволяют защитить от подмены DNS-запрос с помощью шифрования, но реализация поддерживается не всеми приложениями. Рассмотрим простоту настройки DoH для Mozilla Firefox версии 66 со стороны пользователя:
- Перейти по адресу about:config в Firefox
- Подтвердить, что пользователь принимает на себя весь риск
- Изменить значение параметра network.trr.mode на:
- 0 — отключить TRR
- 1 — автоматический выбор
- 2 — включить DoH по умолчанию
- Изменить параметр network.trr.uri выбрав DNS-сервер
- Cloudflare DNS: mozilla.cloudflare-dns.com/dns-query
- Google DNS: dns.google.com/experimental
- Изменить параметр network.trr.boostrapAddress на:
- Если выбран Cloudflare DNS: 1.1.1.1
- Если выбран Google DNS: 8.8.8.8
- Изменить значение параметра network.security.esni.enabled на true
- Проверить правильность настройки с помощью сервиса Cloudflare
Хотя данный способ более сложный, он не требует наличия прав администратора у пользователя, а также существует множество других способов защиты DNS-запроса, не описанных в данной статье.
Вариант 3 (для мобильный устройств):
Использование приложения от Cloudflare для Android и IOS.
Тестирование
Для проверки отсутствия доступа к ресурсам был временно выкуплен домен, заблокированный на территории РФ:
- Проверка HTTP + 80 порт
- Проверка HTTP + 8080 порт
- Проверка HTTPS + 443 порт
- Проверка HTTPS + 8443 порт
Заключение
Надеюсь, данная статья будет полезна и сподвигнет не только администраторов более подробно разбираться в теме, но и даст понимание, что ресурсы всегда будут на стороне пользователя, а поиск новых решений должен быть для них неотъемлемой частью.
Полезные ссылки
- Реализация стандарта Encrypted SNI в Firefox
- Автономный способ обхода DPI
Дополнение вне статьи
Тест на Cloudflare невозможно пройти в сети оператора Tele2, а правильно настроенный DPI блокирует доступ к тестовой площадке.
P.S. Пока это первый провайдер, правильно блокирующий ресурсы.
Каждый день бизнес в России сталкивается с киберугрозами. Любая утечка может обернуться миллионными расходами. Поэтому компании всё чаще устанавливают технологию Deep Packet Inspection для глубокой фильтрации пакетов, чтобы эффективно защищать свои данные.
Рассказали, как работают DPI-решения, зачем они нужны правительствам, провайдерам и корпорациям и какие сегодня есть инструменты для контроля сетевого трафика.
Что такое Deep Packet Inspection
DPI (Deep Packet Inspection, англ. «глубокая инспекция пакетов») — это технология анализа данных, которые проходят через контрольную точку в сети. Вся информация в интернете распределена по блокам данных, то есть пакетам (англ. «packet»). DPI как бы заглядывает внутрь каждого пакета и тщательно изучает всё, что в нём содержится.
Чтобы лучше понять принцип работы DPI, представьте таможню. Пакеты данных — это грузовики, которые перевозят товары через границу. Обычно таможенники проверяют только документы: если всё в порядке, можно ехать дальше — так работает сеть без DPI. А если подключить технологию глубокой фильтрации, таможенники будут открывать кузов каждого грузовика, чтобы проверить товары внутри.
Решения для глубокой инспекции данных бывают двух видов:
- Аппаратное обеспечение. Поставщики продают специализированные устройства с предустановленным DPI, например, маршрутизаторы и сервера. Эти устройства физически подключаются к сети.
- Программное обеспечение. Поставщики продают лицензии на софт, который можно интегрировать в уже существующие системы. Примеры таких программ — СКАТ Гарда DPI и система контроля и анализа трафика СКАТ DPI от VAS Experts.
Аппаратные DPI-решения обычно более надёжные и производительные, но также и более дорогие. Программные же можно установить на имеющееся оборудование, поэтому стоимость у них демократичная. Зато они могут быть ограничены по скорости обработки данных, а также их сложнее масштабировать.
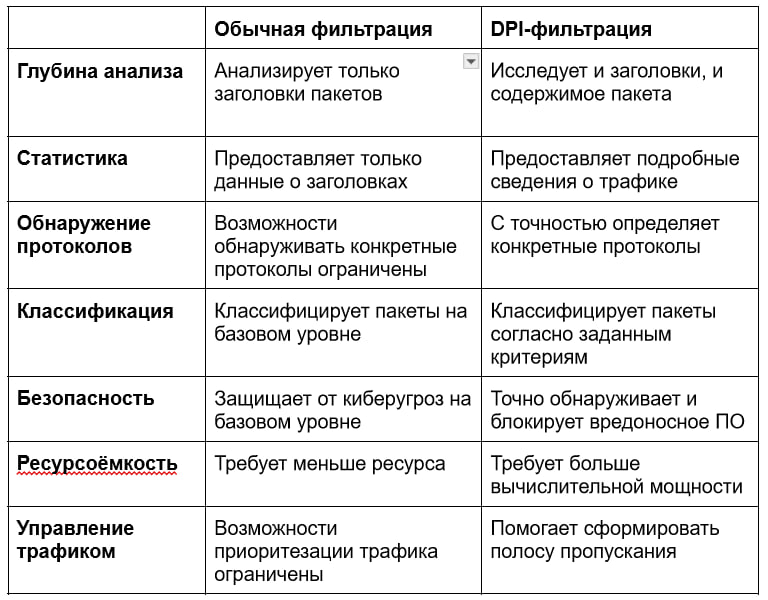
Отличие от обычной фильтрации пакетов
При обычной фильтрации устройство смотрит только на заголовки пакетов. Они содержат IP-адреса отправителя и получателя, номер порта, информацию о длине пакета и другие метаданные.
Deep Packet Inspection идёт дальше: анализирует само наполнение пакета. То есть помимо заголовка оборудование видит и его фактическое содержимое: текст, изображение, аудио, видео.
По сравнению с обычной фильтрацией Deep Packet Inspection обрабатывает бо́льший объём информации. Ведь технология проверяет не только заголовки пакетов, но и их содержимое. Поэтому для глубокой фильтрации нужно больше мощностей, иначе DPI замедлит скорость трафика.
Чаще всего DPI работает на прикладном уровне модели OSI. Это схема, которая описывает этапы передачи данных по сети. Она разделена на семь уровней: самый базовый отвечает за передачу электрических сигналов в кабелях, а последний седьмой — за взаимодействие с конечным пользователем.
Прикладной уровень модели OSI — это действия на уровне пользовательских приложений. То есть DPI проверяет безопасность пакетов в тот момент, когда их передают браузеры, электронная почта, мессенджеры.
Процесс выглядит так: между устройствами отправителя и получателя расположена контрольная точка, например, брандмауэр. Отправитель посылает пакеты данных по сети, и когда они доходят до брандмауэра, система осуществляет блокировку опасного трафика, чтобы он не дошёл до получателя. В итоге пользователи открывают смешные гифки в Firefox, читают сообщения в Telegram, смотрят видео на YouTube — но все эти данные уже отфильтрованы.
Принцип работы Deep Packet Inspection
Инспекция трафика в DPI-технологиях состоит из трёх шагов.
1. Перехват пакетов
Чтобы отслеживать трафик, DPI-оборудование устанавливают в контрольных точках сети — это маршрутизаторы, коммутаторы и другие устройства. Они работают как шлюзы или фильтры: анализируют данные, которые через них проходят, и принимают решения о том, как их обработать.
DPI перехватывает каждый пакет данных, который передаётся по сети, и распаковывает его. То есть расшифровывает внешние слои: Ethernet, IP-адреса, заголовки транспортного уровня. Этот процесс называется декапсуляция — он помогает устройству получить доступ к содержимому пакетов и проанализировать его.
2. Классификация пакетов
Когда DPI-устройство перехватило пакет данных, оно вычисляет, какое приложение или протокол он использует. То есть начинает искать в пакете сигнатуры — определённые комбинации символов или битов. Например, трафик из приложения Zoom имеет характерные признаки, по которым DPI может его распознать.
Сигнатуры хранятся в базе данных. Устройства DPI сравнивают пакеты с шаблонами и затем определяют, что делать с полученными данными.
Также определить тип пакета можно на основе поведенческого анализа. В стандартных шаблонах зафиксировано «нормальное» поведение. Если пакет делает что-то нетипичное, например, отправляет данные на неизвестные адреса, DPI классифицирует его как вредоносный.
3. Анализ содержимого
На этом этапе Deep Packet Inspection извлекает содержимое пакетов и выявляет запрещённые URL-адреса, ключевые слова и опасные программы. Помимо непосредственного контента устройство получает и метаданные: IP-адреса отправителя и получателя, номера портов, временные метки.
Затем DPI переходит к применению сетевых политик — то есть алгоритмов, которые задают правила обработки данных. Например, трафик из приложения Zoom классифицирован как приоритетный — тогда DPI увеличивает скорость передачи пакетов, которые содержат характерные сигнатуры.
Сетевые политики настраивает пользователь, который занимается внедрением DPI. Благодаря этой функции интернет-провайдеры могут предлагать разные сервисы: например, ускоренный стриминг музыкальных платформ. Когда клиент приобретает такую услугу, к его трафику применяются соответствующие сетевые политики — тогда песни в Spotify грузятся быстрее. Однако могут пострадать пакеты из других приложений.
Зачем нужна технология Deep Packet Inspection
DPI полезна для организаций, которым важно контролировать и анализировать интернет-трафик. Среди них — провайдеры, корпорации, госорганы. Рассмотрим основные сценарии, по которым предприятия внедряют DPI-решения.
Сетевая безопасность
Deep Packet Inspection анализирует данные, которые передаются по сети, и фильтрует вредоносный трафик. Допустим, система обнаруживает, что сетевой пакет пытается получить доступ к опасному веб-сайту. Тогда DPI блокирует этот пакет до того, как он достигнет компьютера, чтобы предотвратить потенциальное нарушение безопасности.
Этой функцией часто пользуются бизнесы и организации. DPI защищает корпоративные сети от киберугроз: DDoS-атак, заражения вирусами, фишинга. Также она предотвращает утечки конфиденциальных данных и оперативно блокирует несанкционированный доступ.
Контроль над интернетом
При помощи Deep Packet Inspection можно:
- контролировать, какую информацию люди видят в сети;
- регулировать, какие данные можно передавать через сеть;
- ускорять или замедлять передачу определённых пакетов;
- приостанавливать доступ к конкретным сайтам или приложениям.
Некоторые провайдеры используют DPI для блокировки запрещённых ресурсов, например, пиратских и порнографических сайтов. А компании внедряют эту технологию, чтобы регламентировать, как сотрудники используют интернет. К примеру, в корпоративной сети можно отключить доступ к соцсетям и развлекательным порталам — так у работников будет меньше поводов отвлечься от своих задач.
Правительства используют Deep Packet Inspection, чтобы проверять интернет-трафик и выявлять нарушения закона. Также DPI позволяет увидеть IP-адреса отправителя и получателя пакетов с опасной информацией. Это помогает в антитеррористической деятельности и поимке преступников.
Обеспечение качества обслуживания
Провайдеры используют DPI для реализации QoS (Quality of Service, англ. «качество обслуживания»). Технология помогает оптимально распределять нагрузку между приложениями: повышать пропускную способность для приоритетного трафика или, наоборот пессимизировать его, то есть замедлять.
К примеру, во время расцвета VoIP-телефонии мобильные операторы пытались внедрить блокировку Skype-трафика: интернет помогал абонентам экономить на сотовой связи. Тогда операторы обратились к Deep Packet Inspection — с помощью глубокой фильтрации можно поставить лимит на скорость передачи пакетов от сервисов VoIP. Ограничения мотивировали бы клиентов переходить на новые абонентские планы и приобретать дополнительные услуги. Например, после замедления Skype мобильные операторы могли предложить тариф «Skype без границ», который снимает лимит для VoIP-трафика.
Другой пример — скачивание файлов через BitTorrent. При обычной фильтрации сетевых пакетов провайдеры не могли контролировать, какие приложения забирают больше скорости. Поэтому раньше BitTorrent занимал весь канал и замедлял работу других приложений. С Deep Packet Inspection операторы могут распределять нагрузку между разными программами. Например, ограничить скорость BitTorrent в час пик, когда интернетом пользуется наибольшее число пользователей, а ночью разрешить неограниченный обмен сетевого трафика.
Сбор статистики
Некоторые DPI-решения умеют собирать подробную статистику соединения и разбивать её по параметрам. Примеры таких параметров:
- приложение;
- тарифный план;
- регион;
- тип абонентского устройства.
Поэтому некоторые компании внедряют Deep Packet Inspection, чтобы собрать и проанализировать данные о том, как люди используют интернет: на какие сайты заходят, какие приложения используют, сколько данных передают. Углубленное понимание сетевого трафика помогает разработать решения о том, как далее оптимизировать работу сети и повысить её эффективность.
Допустим, сотрудники компании тратят много времени на то, чтобы работать в Figma. Но им совсем не нужно смотреть потоковые видео в высоком разрешении. Тогда компания может увеличить пропускную способность для пакетов данных из Figma, но ограничить скорость стриминга.
Нарушение приватности. С помощью DPI можно просматривать данные пользователей, а это угрожает их конфиденциальности, особенно при сборе и обработке личной информации. Потенциально использование DPI может привести к утечкам, нарушить права пользователей, а также подвергнуть их опасности, если личные данные попадут в руки злоумышленников.
Замедление сети. Deep Packet Inspection создаёт дополнительную нагрузку на сеть и её компоненты. Анализ каждого пакета занимает больше времени, поэтому DPI снижает скорость интернет-соединения. Это создаёт неудобства для пользователей и вынуждает провайдеров искать способы оптимизировать сеть, чтобы компенсировать задержки.
Риск появления уязвимости. Если некорректно настроить DPI, в инфраструктуре сети возникают уязвимости, которые угрожают её целостности. К примеру, если сеть не успевает обработать столь большой объём данных, это может привести к перегрузке ресурсов и компрометировать инфраструктуру.
Неэффективность против VPN и шифрования. VPN-инструменты — это сервисы обхода блокировки, которые создают зашифрованный туннель между пользователем и удалённым сервером. Если все данные передаются в зашифрованном виде через VPN, анализировать содержимое трафика становится труднее. Но существуют мощные DNI-решения, которые способны распознавать трафик даже после применения VPN.
Цензура. Применение Deep Packet Inspection может привести к ограничениям свободы слова, особенно в странах с авторитарными системами правления. Например, с помощью глубокого инспектирования трафика госорганы блокируют доступ к ресурсам, на которых пользователи публикуют несанкционированную информацию и обмениваются мнениями о политике.
Слежка. Поскольку DPI позволяет просматривать фактическое содержимое пакетов, провайдеры и правительства могут читать личную переписку: сообщения в мессенджерах, электронную почту и так далее. Также метаданные, вроде IP-адресов отправителя и получателя, можно использовать для отслеживания местоположения и активности пользователей.
Как DPI работает в реальных сетевых инфраструктурах
В августе 2024 года российские пользователи столкнулись с замедлением YouTube: не открывается лента видео на главной странице, долго грузятся видеоролики. Чтобы получить доступ к популярному видеохостингу, приходится включать VPN. Замедление осуществили на государственном уровне через технологию DPI: теперь скорость обмена данными с доменом googlevideo.com снижена.
Deep Packet Inspection задействована и в Великом китайском файрволе — это система интернет-цензуры, которая блокирует контент в сети на национальном уровне. Файрвол сканирует сетевой трафик в режиме реального времени и фильтрует его содержимое. Например, в Китае запрещено упоминать протесты на площади Тяньаньмэнь, когда несколько сотен студентов погибли под танками. Сигнатурами для этих трагических событий служат даты протестов, записанные в разном формате: 04.06.1989, 06/04/1989, June 4th, 1989 и так далее. DPI сканирует интернет-трафик и блокирует URL-адреса, которые содержат эти даты.
Также DPI-решения пользуются популярностью у различных организаций. Южно-Уральский государственный медицинский университет приобрёл у поставщика программное DPI-решение, чтобы защищать публикации и фильтровать контент. Межсетевой экран Ideco NGFW VPP помогает университету управлять трафиком, контролировать приложения, предотвращать вторжения и защищать корпоративную сеть от несанкционированного доступа.
Какие решения на основе DPI можно приобрести на рынке
Компании, которые производят DPI-оборудование, как правило, создают собственные классификаторы трафика или используют сторонние. Их устройства делятся на две категории:
- Интегрированные — решения для глубокого анализа, встроенные в телекоммуникационное оборудование: маршрутизаторы, межсетевые экраны и так далее. Популярные производители: Cisco, Huawei.
- Автономные — самостоятельное DPI-оборудование, которое специализируется на кибербезопасности, сборе статистики, блокировке трафика. Более мощное в сравнении с интегрированными решениями. Популярные производители: Allot Ltd., Sandvine, Gigamon, Semptian Technologies, BAE Systems.
Согласно исследованию от фирмы MordorIntelligence, наиболее крупные игроки на рынке оборудования Deep Packet Inspection — Nokia, Huawei, Cisco, ManageEngine, SolarWinds. Наибольшим спросом DPI-решения пользуются в Северной Америке. Рынок постоянно развивается: появляются инновационные решения, такие как NGFW — межсетевые экраны нового поколения, которые могут анализировать трафик на всех уровнях модели OSI.
Чтобы развернуть технологию DPI в офисе, нужно установить специализированное оборудование, способное анализировать сетевой трафик на глубоком уровне. Это можно сделать за четыре шага:
1. Определить, какое оборудование нужно организации: аппаратное или программное, интегрированное или автономное. Выбор зависит от потребностей бизнеса, бюджета и ожидаемых объёмов трафика.
2. Приобрести необходимые решения. На российском рынке не всегда доступны предложения иностранных поставщиков, поэтому компании часто переходят на отечественное DPI-оборудование. Например:
- Аппаратное: nGeniusONE от NETSCOUT, Traffic Inspector Next Generation от Smart-Soft.
- Программное: СКАТ DPI от VAS Experts, Carbon Reductor DPI X от Carbon Soft.
3. Установить оборудование. Как правило, поставщики помогают клиентам подключить DPI-решения к корпоративной сети. А вот более тонкая настройка — это внутренняя задача компании. Необходимо задать правила фильтрации, определить приоритетные типы трафика и так далее. Установкой и настройкой оборудования занимаются сетевые инженеры и специалисты по информационной безопасности.
4. Обучить персонал. Следующий шаг — помочь сотрудникам, которые отвечают за поддержку сети, разобраться в новом DPI-оборудовании. Также важно обновить политику сетевой безопасности для остальных работников: после внедрения DPI прежние рекомендации по кибер-гигиене могут оказаться неактуальными.
Использование DPI должно соблюдать правовые нормы, учитывать приватность и безопасность пользователей, а также защищать их конфиденциальность. Тогда организация будет надёжно защищена от всех связанных рисков.