
iOS users form a significant part of mobile web traffic, making it essential for businesses to ensure their websites perform seamlessly on Safari, the default iOS browser.
Optimizing websites for Safari ensures a seamless user experience. However, debugging on Safari is challenging for Windows users as the latest versions aren’t available. Reliable solutions are needed to test on real iOS devices.
This article explores effective methods for debugging iPhone Safari on Windows, including using BrowserStack’s real device cloud for accurate testing.
Why Debug iPhone Safari on Windows?
Since Safari uses the WebKit engine, it behaves differently from other browsers. Debugging on Windows is crucial to ensure a smooth experience for iOS users.
Websites may have layout issues, touch responsiveness problems, or performance inconsistencies that need to be fixed.
- Identify Safari-Specific Issues: Safari has unique rendering behaviors that can affect CSS, JavaScript, and animations.
- Ensure Touch Responsiveness: iPhones rely on touch gestures, which may function differently compared to desktops.
- Fix Compatibility Problems: Websites should work consistently across different browsers, including Safari on iOS.
- Optimize Performance: Debugging helps analyze load times, responsiveness, and overall user experience.
How to Debug iPhone Safari on Windows?
Debugging iPhone Safari on Windows can be done using two primary methods. If you have access to a Mac, you can use Safari Web Inspector for remote debugging.
Alternatively, BrowserStack provides a seamless way to test and debug iPhone Safari directly on real devices from a Windows system.
Method 1: Using Remote Debugging with Safari Web Inspector
If you have access to a Mac, Safari Web Inspector provides a robust way to debug iPhone Safari directly. It allows real-time inspection of elements, network requests, and performance metrics.
- Enable Develop Mode in Safari: Allows you to access debugging tools when an iPhone is connected.
- Inspect and Modify Elements Live: Check HTML, CSS, and JavaScript directly on the iPhone Safari browser.
- Analyze Network Requests: Monitor API calls, load times, and potential bottlenecks.
- Debug JavaScript Issues: View errors, run scripts, and test code fixes in real-time.

Method 2: Debug iPhone Safari on Windows using BrowserStack
You can use BrowserStack to debug iPhone Safari on Windows. BrowserStack makes iPhone Safari debugging simple, irrespective of the operating system being used.
Windows users (on Windows XP, 7,8,10) can test and debug on the desired iPhone – Safari combination directly from their web browser (Firefox, Chrome, Safari, etc). One simply needs to create a free account on BrowserStack to start testing on a real Safari browser on a real iPhone.
Follow the steps below to get started:
- Sign-up for a free trial on BrowserStack Live.
- Once the account is created, navigate to the Live Dashboard.
- From the available operating systems, choose iOS
- Hover over the desired handset. (Let’s take iPhone 11 Pro for this example)
- From the two options available – Chrome and Safari icon. Click on the Safari logo.


The images above represent how BrowserStack’s real device cloud makes debugging effortless on any iPhone-Safari combination.
Try Debugging on iPhone Safari for free
DevTools on BrowserStack enables a user to remotely inspect the HTML, CSS, and JavaScript components for a particular web-element. Additionally, as teams get access to the latest and legacy versions of iPhones, debugging any issues for a specific iOS device becomes much easier for them.
Apart from remote testing, BrowserStack also allows developers to locally test their work-in-progress web-apps on real devices using the Local Testing feature. One can refer to the Local Testing Documentation to learn more about how to get started with it.
Best Practices for Debugging iPhone Safari on Windows
Without a Mac, debugging on Windows requires alternative approaches. Following these best practices ensures an efficient debugging process.
- Use Real Device Testing: Platforms like BrowserStack provide access to real iPhones for accurate testing.
- Check CSS Compatibility: Safari may handle flexbox, viewport units, and animations differently than other browsers.
- Test Touch and Gesture Interactions: Ensure smooth scrolling, tapping, and swiping, as these may differ from desktops.
- Monitor Performance Metrics: Use tools like Lighthouse to analyze load times and responsiveness on iOS.
- Validate Cross-Browser Compatibility: Compare rendering across Safari, Chrome, and Firefox to maintain consistency.
Talk to an Expert
Conclusion
As mentioned earlier, the latest versions of Safari are not available for Windows users. This makes it very challenging for teams (Windows users in particular) to debug websites on iPhones using a feature like Web-Inspector.
However, platforms like BrowserStack help address this issue by offering real iOS devices for testing purposes, irrespective of the tester’s operating system. Additionally, Local testing and DevTools for iPhones help individuals eliminate testing pain points and make the entire process noticeably easier.
Also, teams do not have to worry about purchasing new handsets or creating an on-premise device lab in order to test software. Simply sign up on BrowserStack, choose the desired iPhone-Safari combination and start debugging.
Frequently Asked Questions
1. Can I debug iOS on Windows?
You can debug iOS apps on a Windows machine using a third-party tool like Xamarin or React Native. You can also access BrowserStack from your windows device and debug iOS devices.
2. How do I inspect my iPhone on Windows 10?
- Login to BrowserStack Live from windows 1o.
- Select iOS as the operating system and select the iPhone that you want
- Browse the website and then right click > Inspect
3. How do I debug Safari mobile browser?
You can debug Safari mobile browser using Safari’s built-in developer tools or BrowserStacj. To enable Safari developer tools, go to Settings > Safari > Advanced, and toggle on the “Web Inspector” option. Then, connect your iPhone to your Mac, open Safari on your Mac, and go to Develop > [Your iPhone’s Name] to access the developer tools. Alternatively, you can debug Safari by logging into BrowserStack Live and selecting the device.
4. Can I use Xcode on Windows?
No, Xcode is only available on macOS, so you cannot use it on a Windows machine. However, you can use third-party tools like Xamarin or React Native to develop iOS apps on a Windows machine.
Try BrowserStack for Free

Motivation
Want to ensure that your website & web application works across different screen sizes and devices? One of the must-dos is to check that it works well on iPhone Safari(as you know, people tend to stick with the defaults and one does not simply tell the user to download another web browser .-.).
Here’s how I debugged a display issue on my website and hopefully it will save you some time when sh*t happens 
Setup
- Problem: something wrong with your website, perhaps due to CSS or JS, but you don’t know why.
- Tools:
- iPhone with Safari
- Windows
- iTunes
- Inspect
Steps
You may be testing your website on your iPhone Safari browser, you realized something is wrong and you want to access the debug console to check any relevant error messages. One available tool is Inspect(not affiliated, just something that worked)
- Create an account (free 30 days trial)
- Download the installer for your OS
- Setup and connect your iPhone according to the instructions given
- Debug!
- DONE
After setting it up, I was able to discover an error message in my debug console:
«ResizeObserver loop completed with undelivered notifications»
…Which I have no idea what that means. So, what else can be done?
If the above does not solve your problem, you might want to find out if you have accidentally introduced a CSS feature that is not yet supported.
To do this, you may want to search for the feature on caniuse. Here is how I found out that the CSS property: aspect-ratio is not fully supported on all iPhone Safari:
- Check caniuse CSS property: aspect-ratio
-
Check your iPhone Safari Settings (as you will see, there are a ton of properties and features that are experimental and not enabled by default)
-
Go to settings -> Safari

-
Go to Advanced
-
Enable Web Inspector(will be required if you use a tool like Inspect)
-
Check if you are ahead of your time (Experimental Features)
-
Cry over hours of wasted time


That’s all. Go back to coding…

May 6, 2018 at 1:59PM
Have you ever needed to debug a website (especially JavaScript or CSS) in Safari on an iOS device but didn’t have a Mac handy? I ran into this problem, and after hours of trying other ways to debug, I finally discovered a pretty easy way to load up a debug interface on my Windows 10 PC that displayed debug info about a website in Safari on an iPad Mini.
[update 10/20/2019 — I’ve heard reports that this solution only works in iOS 12 and below, not iOS 13 and up. I can neither confirm or deny.]
[update 5/6/2018 — I previously included a solution that used WebIDE in the Mozilla Firefox browser, along with the Valence plugin. At some point, possibly beginning with iOS 9, that solution stopped working. I recently had a chance to try some other solutions and found an even easier solution that works with Google Chrome DevTools!]
Thankfully, this solution uses the Google Chrome browser on your PC and the built-in Chrome DevTools that you should already be used to, but the content is coming from the website in Safari on the iOS device.
According to what I’ve read online, it appears this solution only works with Windows 8 and up, so this may not work on Windows 7.
Let’s get to it!
Solution
I recorded a tutorial video of this solution, step-by-step, to go along with this post:
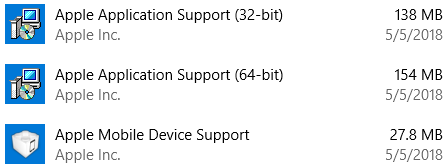
- Install iTunes on your Windows 10 PC.
I installed the 64-bit version. We mostly need the Apple Mobile Device Support and Apple Application Support apps that come with iTunes. I actually uninstalled iTunes after ensuring those other apps were installed, but it looks like you need iTunes installed to connect devices to your PC, so you might want to keep it installed. Here’s what you need to see:
- Install Node.js.
When you install, make sure the package manager is selected (it is by default), as we’ll be needing that to install the webkit adapter. - Run Windows PowerShell as administrator.
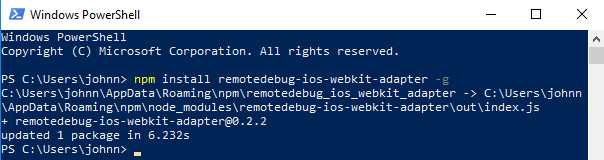
Press theWindows Key + Sto search, then search for «PowerShell». Right-click on Windows PowerShell and click Run as administrator. - Install the remotedebug-ios-webkit-adapter.
Use the following PowerShell command:npm install remotedebug-ios-webkit-adapter -g
When that is complete, you will see an «updated 1 package in Xs» message:

- Connect your iOS device to your Windows 10 PC via USB.
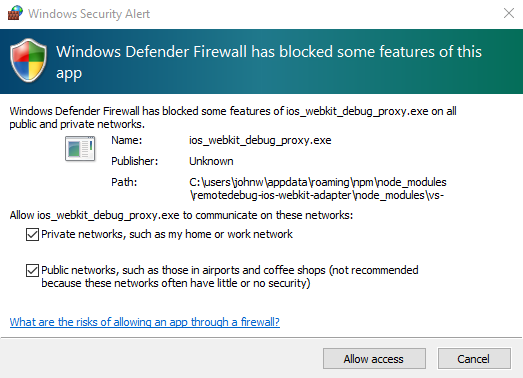
If you haven’t connected the devices previously, you will need to click to trust the connection on both devices. - Start the webkit adapter plugin listening on port 9000.
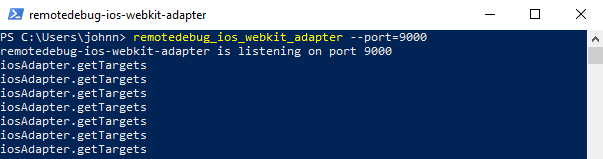
Paste the following command into PowerShell:remotedebug_ios_webkit_adapter --port=9000
You will need to allow the plugin through your firewall as well. I use the default Windows Firewall, so I got a dialog like this:

Once it begins running, you will see the message remotedebug-ios-webkit-adapter is listening on port 9000 followed by iosAdapter.getTargets:

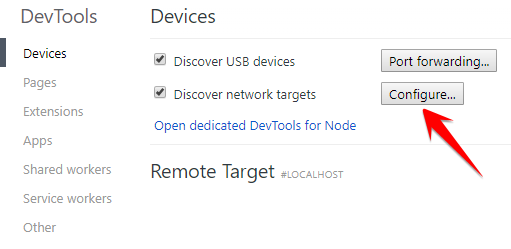
- Open up the Chrome browser and browse to chrome://inspect/#devices.
Since we set the adapter to listen on port 9000, we need to add a network target. Click «Configure» next to Discover network targets:
Then, make sure the target «localhost:9000» is in the list:
- Enable web inspector on your iOS device.
On your iOS device, go toSettings > Safari > Advancedand enable Web Inspector. - Open Safari on your iOS device and browse to a website.
You should almost immediately see the website appear in Chrome under the Remote Target section:
- Click inspect under the target.
Success! You can now debug the site in Safari on your iOS device, but from Chrome DevTools on your Windows machine.

It should take you around 5 minutes to set this up, and you can be debugging a website in no time!
Using iOS 11?
You may need some extra steps to get this working on an iOS 11 device. Evidently, the version of the remotedebug-ios-webkit-adapter downloaded via npm is broken for iOS 11. The user bdice wrote a post on the remotedebug-ios-webkit-adapter Github Issues page describing how he was able to get this working on Windows 10 with an iOS 11 device. I tested it out, and here’s the lowdown:
- Download the most recent ZIP release file of remotedebug-ios-webkit-adapter.
I downloaded version 1.8. - Create a new folder named «ios-webkit-debug-proxy-1.8-win64-bin» in the following path (assumes you installed Node.js in the default directory):
%AppData%\npm\node_modules\remotedebug-ios-webkit-adapter\node_modules\vs-libimobile\ - Extract the files from the ZIP to that folder.
If you used my assumptions and suggestions above, the path should be:%AppData%\npm\node_modules\remotedebug-ios-webkit-adapter\node_modules\vs-libimobile\ios-webkit-debug-proxy-1.8-win64-bin - Edit the iosAdapter.js file.
Open the file from the following location:%AppData%\npm\node_modules\remotedebug-ios-webkit-adapter\out\adapters\iosAdapter.jsOn line 132, change the
proxyvariable to the following value:const proxy = path.resolve(__dirname, '../../node_modules/vs-libimobile/ios-webkit-debug-proxy-1.8-win64-bin/ios_webkit_debug_proxy.exe');
After you have jumped through all these hoops, I would restart Windows PowerShell (as Administrator!), restart Chrome, and unplug then plug back in your iOS device, just to be safe. After doing so, go back to step 6 above, and when you get to step 9, you should now see your device under the list of Remote Targets!
I tested this out, and it definitely worked!
Your Turn!
Have you tried debugging a website in Safari on iOS with a Windows machine before? How did it work out for you, and what tool(s) did you use? Or did you have a problem with this solution you’d like to discuss? I’d love to hear from you, so let’s discuss in the comments below!
Remote Debugging iOS Safari on Windows and Linux
Using this project you can debug your websites and web applications running in iOS Safari from a PC running Windows or Linux.
It provides a free and up-to-date alternative to the discontinued remotedebug-ios-webkit-adapter by RemoteDebug and is the spiritual successor to the abandoned webkit-webinspector by Arty Gus. It is a free and open source alternative to inspect.dev.
The setup scripts (generate.sh or generate.ps1) download the latest version of WebKit’s built-in WebInspector and patch it to work with the WebSocket ios-webkit-debug-proxy provides and to be compatible with Chromium based browsers.
Having trouble getting this tool running? Join the Discord community:
If you are looking for a more modern, self-contained tool built in Go, check out Hazel’s ios-safari-remote-debug.
Requirements for running
ios-webkit-debug-proxy- On Windows, it will automatically be downloaded, but you must also install and trust the device in iTunes for it to work
- For Linux, please follow the installation instructions.
- Node.JS http-server or Python or PHP
- If you have Python or PHP on your system, you don’t need to change anything
- If you have Node.JS on your system, just run
npm i -g http-serverand you’re set.
- A Chromium based browser
- like Google Chrome, Edge or Opera
- or WebKit based browser
- like Epiphany/GNOME Web
Requirements for setup
git(required bygenerate.shorgenerate.ps1) for downloading WebKit source code- On Windows, I suggest using
gitfor Windows in PowerShell - On Linux, I suggest installing
gitfrom your package manager
- On Windows, I suggest using
Instructions
Setup
- Clone this repository to your PC
- On Windows, run
generate.ps1. On Linux, rungenerate.sh.
This will result in the folder WebKit being created inside src. It contains the WebInspector files.
Running
- Plug your iOS device into your PC via USB
- On Windows, open iTunes and mark the iOS device as trusted (pop-up asks for confirmation the first time you connect a new device)
- On the iOS device, confirm that you trust the connection if asked
- Go to
Settings->Safari->Advanced->Web Inspectorand enable it - Open the website you want to debug in Safari
- On Windows, run
start.ps1. On Linux, runstart.sh. Make sure your iOS device’s screen is unlocked. - The
ios-webkit-debug-proxywill show your iOS device’s name as connected. - Then open the Chromium or WebKit based browser of your choice with the following URL:
http://localhost:8080/Main.html?ws=localhost:9222/devtools/page/1- If you have mutliple pages open or extensions installed, refer to http://localhost:9222/ for the page number that is at the end of the URL
- You should be greeted with the WebInspector and can now debug to your heart’s content.
Troubleshooting
- If you get an error like
Uncaught (in promise) Error: 'Browser' domain was not foundfromConnection.js:162you are trying to inspect a page that is not inspectable (this could be caused by having Safari extensions installed). Refer to http://localhost:9222/ for the available pages and put the correct one at the end of the URL (for examplehttp://localhost:8080/Main.html?ws=localhost:9222/devtools/page/2) for inspecting the second page. - In case your inspector window stays empty, open the dev tools of your local browser to check the console for errors.
- If you get an error like
WebSocket connection to 'ws://localhost:9222/devtools/page/1' failed:fromBrowserInspectorFrontendHost.js:97, try unplugging your device and plugging it back in while the site you want to debug is open in Safari. Once you see the ios-webkit-debug-proxy console window display a message likeConnected :9222 to Himbeers iPad (...), refresh the inspector page inside your browser (do not use the refresh button on the inspector page, refresh the entire site from your browser).
- If you get an error like
Exiting
Windows
- Two windows will open. One manages the web server and the other one is
ios-webkit-debug-proxy. - To exit, close the
ios-webkit-debug-proxywindow, the other one will close automatically- Alternatively you can also press Ctrl+C in the web server window
Linux
- Press Ctrl+C in the terminal window to exit
Known Issues
- «Events» on the «Timelines» tab don’t work
- Canvas content doesn’t show on the «Graphics» tab
- Minor style glitches due to Webkit vs. Chromium differences
Notes
If you want to see details about how this was made, you can read a detailed explanation in HOW_IT_WORKS.md (note that this document only describes how the very first version of this tool was created and might not be completely up-to-date).
Attribution
- This project was made possible thanks to
- webkit-webinspector for the idea
- ios-webkit-debug-proxy for the ios-webkit-debug-proxy tool
- WebKit for the WebInspector itself
Here is a 2500+ word blog post on how to debug iPhone Safari on Windows:
As a web developer or quality assurance engineer, ensuring your website works flawlessly on iPhone Safari is critical given iOS‘s massive market share. However, not having access to the latest Safari browsers on Windows can make debugging a frustrating endeavor.
In this comprehensive guide, I‘ll walk you through several methods to debug the iPhone Safari browser on a Windows machine. With over a decade of experience in cross-browser testing, I‘ll share expert tips to streamline your debugging workflow.
Why Debugging iPhone Safari Matters
Let‘s first understand why testing on the iPhone Safari browser is so important.
As per Statcounter, iOS holds over 24% of the global mobile operating system market share as of January 2023. In the US alone, over half of all smartphones run on iOS.
Given iOS‘s popularity, website visitors accessing your site via iPhones could range from 25% to 50% depending on your target demographic.
Moreover, Safari continues to be the default browser on all iOS devices, including iPhones and iPads. Most iOS users tend to stick with Safari for their daily browsing needs.
Considering these statistics, not optimizing your website for iPhone Safari can lead to a subpar experience for a significant chunk of your mobile visitors. Site elements like menus, images, videos, etc. may not render properly. Core functionality could break without warning.
Such a fragmented mobile experience frustrates users quickly. You risk losing customer trust, engagement, and potential conversions.
By thoroughly debugging iPhone Safari, you can identify and fix rendering issues, JS errors, CSS conflicts, and more. Your site will offer reliable performance regardless of the iOS device or Safari version. The key is choosing the right debugging tools.
Challenges of Debugging Safari on Windows
As a Windows user, debugging the latest Safari browsers poses some unique pain points:
-
Apple does not release Safari for the Windows operating system. The last available version was Safari 5.1.7 released nearly a decade ago in 2012.
-
Using the outdated Safari 5.1.7 provides limited value. It lacks support for modern web standards and performs differently from the current Safari browsers found on recent iPhone models.
-
You cannot access the iOS Simulator without installing Xcode developer tools. However, Xcode only works on macOS devices, not Windows machines.
-
Building an in-house iOS device lab with various iPhone models is complex and expensive.
So how do you overcome these roadblocks? Let‘s explore proven methods and tools to debug iPhone Safari flawlessly on Windows right now.
Method 1: Use BrowserStack Live
BrowserStack Live provides instant access to real iOS devices and Safari browsers through the cloud. With BrowserStack, you can debug the latest Safari versions on iPhone 13 Pro Max or older Safari releases on an iPhone 7 Plus.
As a cross-compatible cloud testing platform, BrowserStack works seamlessly on Windows 7, 8.1, and 10 without needing any downloads or installations.
Follow these simple steps to start debugging iPhone Safari on Windows using BrowserStack:
- Sign up for a BrowserStack free trial account
- Access the Live testing dashboard from your Windows browser
- Select «iOS» as the mobile operating system from the left sidebar
- Hover over your preferred iPhone model like the iPhone 14 Pro
- Click on the Safari icon to launch a live Safari browser session on the chosen device
Once Safari initializes, you can access the website you wish to debug directly on the iPhone browser:
Key Debugging Features
- Test on multiple iOS versions like iOS 9, 10, 11 as well as the latest iOS 16.
- Debug Safari across iPhone models – old and new.
- Inspect elements via the accessible Safari Web Inspector.
- Emulate geo-locations and network conditions (3G, 4G, etc.)
- Integrates with developer tools like Selenium and Appium for advanced sessions.
- Supports authentication allowing secure debugging of live apps and sites.
- Team collaboration enabled through built-in issue tracking and annotations.
With these capabilities, BrowserStack empowers developers to identify rendering inconsistencies, JS errors, and other iPhone Safari issues from their Windows devices effortlessly.
Key Benefits
- No need to purchase Apple hardware or maintain an in-house iOS device lab
- Provides the latest iPhone and Safari browser versions instantly.
- BrowserStack works directly on your Windows machine with no additional tools required.
- A scalable and cost-effective solution allowing testing on hundreds of real iOS device and browser combinations.
- Free trial availability enables first-hand evaluation before purchase.
In summary, BrowserStack is the fastest way to stabilize your web or mobile app across iPhone Safari browsers on Windows – irrespective of your team‘s skill levels.
Method 2: Use a Windows iOS/Safari Simulator
Though not officially supported by Apple, a few third-party tools offer iOS simulator capabilities on Windows. These include:
-
Genymotion: A complete Android & iOS emulator for app testing and development purposes. It provides a Safari browser capable of rendering web pages relatively accurately as compared to the real iOS Safari browser.
-
iPadian: Simulates the iOS interface, dock, and home screen on Windows. It contains a built-in Safari browser alternative with partial web standards support.
Here’s a quick guide to getting started with Genymotion for iPhone Safari debugging on Windows:
- Download, install and open the Genymotion app on your Windows 10/11 machine
- Sign up for a free personal account
- Click on “Add New Device” and select iPhone 11 Pro or another model
- Genymotion will automatically install the selected iPhone simulator
- Once setup completes, launch the iPhone simulator
- Open the pre-installed Safari browser to access your website
- Use browser developer tools to inspect page elements and diagnose issues
Key Points:
- Provides a cost-effective Safari simulation without paying for Apple hardware.
- Lets you evaluate basic to moderate rendering and functionality.
- Rapidly test websites on different simulated iPhone models.
However, there are some downsides to consider:
- Simulation accuracy is not on par with real iPhones, especially for graphics-heavy apps.
- Limited dev tools support compared to Safari Web Inspector.
- Lacks advanced debugging capabilities like network throttling.
- Genymotion offers 1 simulated device for free, while paid plans start at $136 per year.
In summary, Genymotion presents a reasonably reliable Safari sandbox for basic iOS web debugging on Windows. But for advanced testing, real iPhone devices are highly recommended.
Method 3: Use Remote Debugging Tools
Remote debugging tools enable connecting an actual iOS device to your Windows computer for testing purposes. Some noteworthy options include:
-
Weinre: An open-source debugger supporting remote access via a client-server model. Weinre allows inspecting the DOM and debug JS code on connected iOS and Android devices.
-
Vorlon.js: Another popular OSS tool providing remote device and browser testing. It assists with interactive debugging across platforms.
-
Remote Debug iOS WebKit: This Native App Store utility sets up a WebSocket server on your iPhone. It subsequently channels debugging data to Chrome DevTools on your Windows system.
Let‘s see how to use Remote Debug iOS WebKit for debugging iPhone Safari on Windows:
- Install the «Remote Debug iOS WebKit» app on your iPhone from the App Store.
- Ensure both the iPhone and Windows PC connect to the same WiFi network.
- Access the debugging app on the iPhone and note down the unique WebSocket URL.
- Open Chrome browser on your Windows system, and head to the Chrome DevTools panel.
- Enter the iPhone‘s WebSocket URL under the «Devices» section in DevTools to pair both devices.
- Now visit the desired webpage on Safari browser of your iPhone.
- Debugging data including the loaded page‘s DOM will sync in real-time to the Windows Chrome DevTools.
Utilizing such remote tools paves the way for detailed web app debugging leveraging actual iOS hardware without an underlying OS limitation.
However, factors like needing the iOS device‘s physical presence during testing can hamper scale. Individual licenses for commercial tools also add to the costs substantially for larger teams.
Top Debugging Tips for iPhone Safari on Windows
Through my extensive experience in debugging complex web apps on iPhone Safari from Windows machines, here are some proven best practices:
-
Use the latest Windows 10 or Windows 11: They provide better hardware support for iOS devices and improved compatibility with remote debugging tools.
-
Enable web developer options on iOS: Head to Settings > Safari on your iPhone and toggle on options like «Web Inspector» for debugging access.
-
Inspect individual site elements: Check headers, menus, forms, videos, etc. separately for isolated debugging.
-
Throttle networks: Emulate real-world 3G, 4G, and WiFi connections during testing.
-
Compare device models: Debug a few iPhone generations to gauge Safari performance consistency across versions.
-
Try landscape orientations: Rotate to landscape mode and re-test sites as the experimental mobile layout could uncover more bugs.
-
Access integrated developer consoles: Safari‘s Web Inspector and Simulator‘s Dev Tools provide device and error logs essential for quick diagnosis.
-
Use a logging framework: Implement detailed logging via JS frameworks like Log4js for tracking app issues.
By adopting these tips during debugging, you can rapidly identify and resolve rendering and functionality failures across iPhone Safari browsers from your Windows desktop.
Frequently Asked Debugging Questions
Now that you know how to efficiently debug websites on iPhone Safari despite using Windows, let‘s address some common troubleshooting questions:
Can I debug iOS fully on Windows without a Mac?
Yes, you can accurately debug production iOS apps and mobile websites on Windows PCs through cloud testing solutions. BrowserStack and Genymotion both enable comprehensive debugging without needing macOS machines.
However, for Xcode development workflows, macOS remains essential as Xcode IDE runs only on Mac devices natively.
Is the iPhone Simulator on Windows identical to a real device?
No. As detailed before, while third-party iOS simulators on Windows provide close approximations, they cannot replicate real iPhones entirely – especially complex graphics processing.
Subtle rendering differences and hardware discrepancies remain. Real devices deliver optimal debugging accuracy.
How do I inspect iPhone elements on Windows 10?
First, ensure Windows 10 and the target iPhone connect to the same WiFi network. Next, use remote debugging tools like Weinre or Remote Debug iOS Webkit to channels iOS debugging data to Windows.
Now, leverage Windows DevTools in Firefox/Chrome or Safari to inspect individual page elements surfaced from the connected iPhone.
Can I leverage Xcode debugging on Windows?
Unfortunately, no. Xcode development suite exclusive supports macOS. However, alternatives like Visual Studio on Windows provide similar Integrated Development Environments – incorporating debugging toolsets – for cross-platform app coding.
You can also opt for cloud debugging via BrowserStack that facilitates app debugging across over 2000 device and browser combinations, including iPhone Safari on Windows.
What‘s the easiest way to debug Safari mobile?
The simplest approach entails using BrowserStack Live. It delivers instant access to real iOS devices on Safari browser without any environment setup or hardware maintenance overheads.
BrowserStack streamlines debugging Safari mobile browser versions across iPhone and iPad models seamlessly through an intuitive cloud-based interface accessible from Windows desktops.
Conclusion
To wrap up, debugging the default iPhone Safari browser no longer requires owning Apple devices when you use Windows machines for development.
As outlined in this guide, a range of practical solutions enable seamless debugging – ranging from real device clouds like BrowserStack to remote simulators such as Genymotion.
While local iOS simulators provide convenience, leveraging actual iPhone hardware unlocks the most accurate debugging for identifying real-world mobile issues accurately.
By picking suitable debugging tools aligning with your workflow, budget, and testing needs, you can bolster iPhone Safari compatibility remotely from Windows desktops itself.
So try out these handy options shared to start fixing frustrating iOS issues for your web visitors even without switching operating systems!