Keeping an eye on your CPU temperature is crucial for maintaining your computer’s performance and longevity. Overheating can cause system instability, crashes, and even hardware damage. In this guide, we’ll show you how to monitor your CPU temperatures on Windows 10 and 11 using a free tool called Hardware Info.
Key Takeaways
- Hardware Info is a reliable tool to monitor your CPU temperature.
- You can check individual core temperatures for more detailed monitoring.
- Keeping your CPU temperature within safe limits helps prevent damage.
Step-by-Step Guide to Check CPU Temperature
Follow these steps to easily check your CPU temperature in Windows 10 or 11:
Step 1: Download Hardware Info

- Open your web browser and visit the official Hardware Info download page.
- Choose the portable version for a quick setup. Download the file from a nearby server for faster access.
Step 2: Extract the ZIP File

- After downloading, locate the ZIP file in your Downloads folder.
- Right-click the file and select Extract To using an extraction tool like 7-Zip.
Step 3: Run Hardware Info

- Open the extracted folder and run the Hardware Info 64-bit application. If you have a 32-bit system, use the 32-bit version instead.
- Click Start when prompted to begin the system analysis.
Step 4: Access CPU Temperature

- Once the application is running, close any unnecessary pop-ups until you reach the main screen.
- Click on the Sensors button to open the sensor status screen.
- Scroll down to find the CPU section, which will display the current, minimum, maximum, and average temperatures.
Why Monitoring CPU Temperature is Important

Monitoring your CPU temperature helps ensure your computer is running efficiently. Overheating can lead to performance drops and even physical damage to your system. Keeping your CPU cool by monitoring temperatures regularly is one of the simplest ways to avoid these issues.
Pro Tip: The ideal CPU temperature should generally stay below 85°C under heavy load. Anything consistently above this could indicate that it’s time to improve your cooling setup.
Tools to Help You Monitor Your PC Health

While Hardware Info is a great tool for checking your CPU temperature, there are other applications available for monitoring your entire system. Tools like LibreHardwareMonitor also provide real-time temperature readings and can help you track your hardware’s health over time.
Conclusion
Monitoring your CPU temperature is an easy but essential part of maintaining your computer’s health. Using Hardware Info makes this process simple, and it gives you detailed information about your CPU and other components. By following this guide, you can ensure your CPU stays within safe operating limits, helping you avoid costly repairs down the line.
Stay proactive and keep an eye on your system’s health. A cooler CPU means a longer-lasting and better-performing computer!
FAQs
1. What is a Safe CPU Temperature?
A safe CPU temperature typically ranges between 40°C to 85°C, depending on the workload. If your CPU consistently stays above 85°C, it could be a sign that your cooling system needs an upgrade.
2. Can I Check CPU Temperature Without Third-Party Software?
No, Windows does not offer a built-in feature to check CPU temperature. You will need to use third-party software like Hardware Info or LibreHardwareMonitor to monitor your CPU temperature.
3. Does Overheating Damage the CPU?
Yes, excessive heat can cause permanent damage to your CPU and other components. Prolonged exposure to high temperatures can reduce your CPU’s lifespan and lead to performance issues.
4. How Often Should I Check My CPU Temperature?
It’s a good idea to check your CPU temperature periodically, especially if you notice unusual behavior like slowdowns or crashes, or if you are running resource-heavy applications.
5. Can Cleaning My Computer Help Reduce CPU Temperature?
Yes, dust buildup can restrict airflow and cause higher temperatures. Regularly cleaning your computer’s internal components can help improve cooling and reduce your CPU temperature.
Have you ever found that the CPU of your computer has become too hot? Overheating can be a reason, if you see your PC starting to lock up, spontaneously shut down, or act sluggish while working on any intense tasks. You can face the issue mainly when the intense summer heat is scorching. Remember that most computer temperatures fall within a safe range. However, if your processor exceeds the maximum temperature for prolonged periods, you can see problems arising. It is why you should have a CPU temp monitor with the help of which you can see your PC state in real time. Go through the article to learn how to monitor CPU temperature in Windows 10.
Why is Your CPU Temp So High?
You should know that the CPU performs a lot of operations in each second. As a result, the processor can become very hot. High CPU temps can be seen when you run high-intensity tasks simultaneously. Suppose your CPU has dust buildup, a faulty fan, or is facing ventilation problems. These can impact the ability of the PC to cool down the temperature.
If you don’t realize that your CPU temps get too hot, you can even experience system stability problems, crashes, and slowdowns. In addition, you might see long-term damage. These are the causes of the high CPU temperatures:
-
Intensive Simultaneous Operations:
Suppose you run many high-intensity tasks at a time. In such a case, you can see the temperature of your CPU spiking, resulting in your computer slowing down. If your CPU reaches a critical temperature, the CPU needs to be forced to throttle itself. Hence, you need to know how to increase the speed of your PC and clean up the computer. Do the core temps and speed not improve? If so, then you need to use a PC optimization tool in order to detect performance hogs. It can keep the PC running smoothly.
-
Overclocking:
If you try to overclock and push the GPU beyond its limits, your PC’s temperature will increase for sure. Are you a gaming PC builder or an overclocker? Then, you can try to monitor the CPU temperatures.
-
A Faulty PC Fan:
For a laptop fan, it is quite normal to spin even when nothing is happening, and the machine remains idle. If you see that your fan is unable to work properly, the fan will not be capable of cooling down your machine. As a result, you can hear loud fan noises for a prolonged time. Suppose your computer fan has been loud for a long time. Then, it might happen that your fan is trying to cool things down desperately. You need to check the Task Manager in order to see the processes that you can close. Then, if you still hear the noise, you need to replace the fan.
-
Dust Buildup:
Some older PCs can gather dust inside the PC chassis. It can slow down your fans and clog them. This incident impacts your computer’s cooling functions. You need to check for high PC temperatures. It is because the high CPU temps indicate that you need to clean out dust or replace fan units. Whenever you plan to fix the overheating problem in your PC, your first task is to clean its physical components.
-
Limited Ventilation Space:
Suppose your computer sits on a surface used to inhibit air circulation. Or suppose you have a thin ultrabook. If so, then there may not be sufficient space for your laptop for ventilation and cooling. So, what you can do is check the processor temperatures when you run any intensive task on a thin laptop. Also, you need to keep the PC on a hard surface that does not trap air.
-
System Freezes And Crashes:
Has your PC crashed or shut down randomly? If so, then ensure that it isn’t happening due to a hardware or software defect. A system running excessive heat could turn off automatically in order to prevent physical damage ( i.e. long-term damage) from heat. You can set the max temperature to run a PC in the BIOS.
What CPU temperature is Normal?
A normal temperature of the CPU relies on the processor you are using. Basically, a temperature is considered safe when it ranges between 40–65°C (or 104–149°F) for a normal workload. When you play games or run more intensive apps, the CPU temp range will increase, and it will remain between 70–80°C (158–176°F).
80-85°C (176–185°F) or above temperature is considered a bad CPU temp. If you don’t play games or run any resource-intensive program but the temperature still has reached, then it might be a major problem. Remember that if you are not playing games, the ideal CPU temp should range 45-60°C (113–140°F).
If your desktop gaming PC has the high-end CPU, you can see around 50°C (122°F) CPU temperature without running anything excessively. You might know that an Ultrabook barely has space for a powerful CPU. So, core temps can hover around 75°C (167°F) on any regular day.
Does your CPU overheat constantly? Then, you can try cooling processes that are more useful in order to avoid permanent damage to your computer. Hence, you can try an effective PC cleaner software to prevent the issue. The reason is that old programs and malware bring CPU usage.
Why is Monitoring CPU Temperature Important?
The CPU is the computer’s brain. When you run a computer, it will generate heat. When the heat isn’t dissipated effectively, your computer can slow down or crash it. Even your hardware can be damaged by overheating. Sometimes, it causes your CPU to fail permanently.
You need to monitor your CPU temperature to detect potential problems before these turn out to be major trouble. It lets you take preventive measures in order to keep the hardware cool. Thus, it becomes possible to prolong its lifespan. It makes sure that your computer is running smoothly.
When you monitor CPU temperature, it will let you manage fan noise. There are a few fans that become louder with the higher CPU temperature. It happens because the cooling system attempts to dissipate the excess heat with the aim of keeping hardware safe. The noise can be disruptive under a heavy workload. It can even interfere with regular activities.
In order to avoid overheating, the processor needs to reduce the voltage or clock speed for higher temperatures. It can result in reduced performance along with slower processing speeds.
Installing a free CPU heat monitoring tool and monitoring the temperature for spikes is the simplest way of checking the CPU temp. Besides, you are capable of checking the CPU temperature with the help of Windows’ default BIOS/UEFI tool.
The process you need to follow to check the temperature of your CPU using this free best CPU temp monitor tool is as follows:
- First, you need to download and install the tool named Core Temp if used.
- Then, you can see the main dashboard by opening the app.
- After that, you need to monitor the temperature for every CPU core under Temperature Readings. Monitoring the highest processor temperature that the temperature record is possible in the Max column. You get to see each core’s current CPU load in the Load column.
How to Check CPU Temperature in The BIOS:
Checking the temperature in the BIOS or UEFI system is possible, but you get to see the temperature only when the PC is idle. If you boot your device into Windows 10 or another OS, you can see higher temps.
Entering BIOS is easy for checking CPU temperature. On most platforms, you have to reboot the system. Then, your task is to click delete or F2 repeatedly once it restarts. Remember that not all motherboards enlist the CPU temperature in the BIOS. However, enthusiasts or DIY motherboards do this. As soon as you are in the BIOS, you get to see the temperature in the Hardware Monitor section. However, it can be named as PC Health Status or Status.
Other Ways To Check CPU Temperature In Windows:
When you use your device, it is not so easy to check PC temperature using UEFI/BIOS. Your BIOS may or may not be compatible with temperature monitoring. However, several apps can assist you in checking CPU temperature in Windows. Most of these will inform you about the hard disk/SSD temperature, the GPU temperature, and the ambient temperature.
-
ThrottleStop:
With the help of this tool, you can undervolt your CPU so that it can cool down temperatures immediately. This tool helps to prevent throttling. In addition, you can measure your CPU temperature and take readings from the home screen.
If you want, allow the CPU temperature to be visible in the notification area on the computer. In order to do so, your first task is to click Options at the bottom of ThrottleStop. After that, you have to check the CPU Temp box in the middle. Whenever you open ThrottleStop, you get to view a little number in the taskbar notification area that displays the current CPU temperature.
-
HWMonitor:
This one is a fast way of checking CPU temperature. After installation, the app is simple to run.
You need to scroll down in the main HWMonitor pane to see if the CPU has all the information in the list. Besides, you can see every core’s voltage. It showcases the current temperature and the minimum and maximum temperatures.
-
Speccy:
This one is a lightweight tool that can be used to retrieve and check the CPU temperature information. Once you complete downloading and installation, you need to navigate to the CPU section column on the left. It displays all relevant temperatures for a laptop.
Do you want the temperature to appear in the tray? If so, then you need to click View and then Options. After that, your task is to click on the System tray. Then, you have to click on Minimize to Tray. Next, you should click Display Metrics in the tray. After that, you have to choose the CPU. The real-time CPU temperature graph will be made on the screen for monitoring sudden spikes when you play games for a long period.
-
HWinFO:
It is a free Windows diagnostics software that is compatible with Intel processors like Xeon/Atom, Core i9, etc. In addition, it supports most AMD processors. But it isn’t compatible with the latest Ryzen family.
Once it launches the dashboard, your task is to move to the Sensor tab. Then, you need to check temperature values for different CPU cores under the Sensor menu. Now, right-click to add temperature values to the system tray. You should click on Show Graph to monitor the rise in temperature of your CPU over time.
-
Open Hardware Monitor:
If you want all the essential statistics in a single place, this tool can become very handy. The temperature can be seen under the category with the CPU’s name. Then, it lists the temperature for every core of your processor. Do you want to view the CPU temperature in the taskbar? Then, you need to right-click the temperature. After that, you have to click Show in Tray.
-
Ryzen Master (AMD Ryzen CPUs only):
Does your PC run on a Ryzen CPU? Then, use an AMD proprietary tool known as Ryzen Master. You can use this tool to measure your CPU temperature more accurately. It has access to readings, a special benefit that you do not see in other CPU monitoring tools. In order to download this tool, navigate to the official AMD page. If you want to use this tool, first open the application in order to view the temperature. You can compare this temperature with the maximum temperature limits which your processor supports.
How to Monitor Your CPU Temperature While Gaming:
Taskbar is not visible when someone plays a game in full-screen mode. ALT+TAB can create more issues than it is worth to check a computer temp. However, as a gamer, you are able to use a good CPU temperature monitor Windows 10, for gaming. The process to monitor your CPU temperature when you play games is as follows:
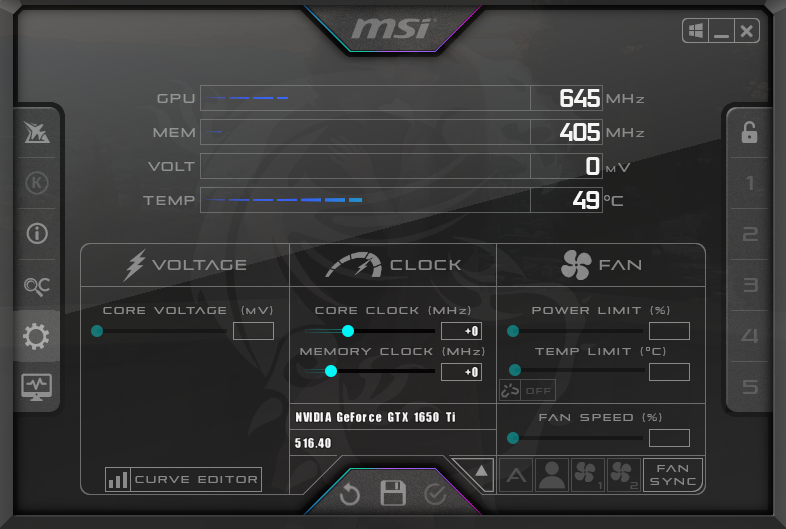
- Your first job is to download RiverTuner/MSI Afterburner, and then you need to install this.
- As soon as you install this, you need to click the arrow in the taskbar’s notification area. Then, you have to select MSI Afterburner. Otherwise, you can double-click the MSI Afterburner shortcut on the desktop.
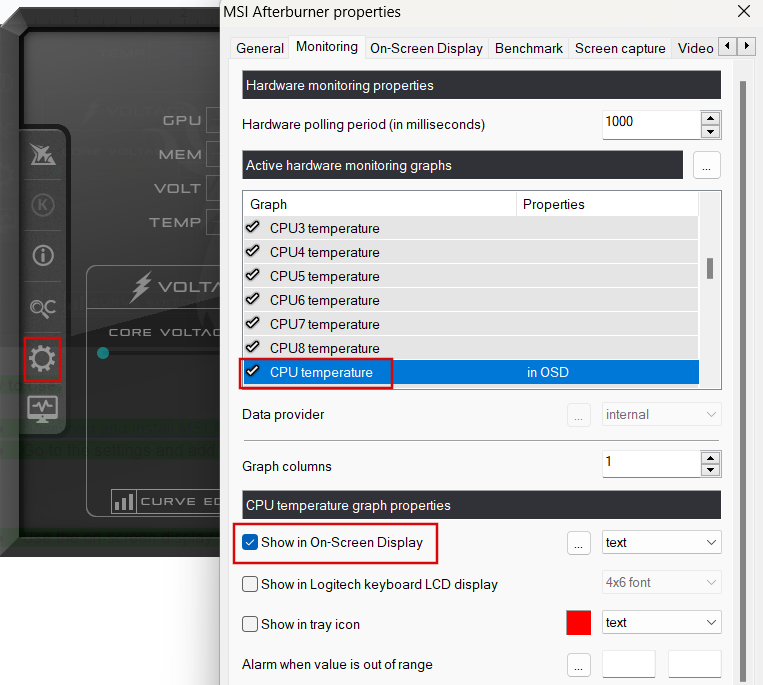
- Next, your task is to click the Settings icon. Then, you have to select the Monitoring tab. Now, you need to scroll to the CPU temp in the available list. Then, you have to click this. Now, your task is to enable Show in On-Screen Display.
- At last, your task is to launch your game. You can see these automatically so that you are capable of monitoring the PC temperature while gaming.
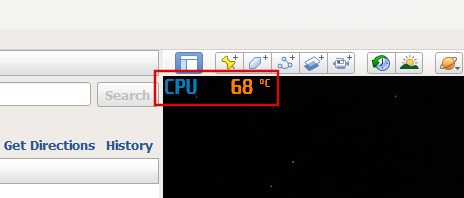
When you play games, monitoring other states is possible also. In this case, you need to open the Monitoring tab in MSI Afterburner. Thereafter, your task is to select GPU temps, RAM memory, or usage stats. You can see the numbers available near the CPU thermometer in the screen’s top-left corner while gaming.
What is an Ideal CPU Temperature?
Usually, the average temperature for Intel or AMD processors is under 60°C (140°F). We have given here the process to find out the ideal CPU temperature for Windows. Hence, you need to look for Device Specifications under Settings to grab your CPU data’s quick summary. Then, you have to go to System and then About. You need to note down the processor name & details, including the GHz frequency.
Are you willing to know the maximum temperature of your processor? Then, you need to go online and search for your CPU’s product page. Now, you have to find the maximum ideal temperature in the list. Suppose you see the temperature under something similar to “Maximum Operating Temperature” or T Case. Remember that you need to strive for the temperature in order to keep the processor under most of the time.
Does it say T Junction? It is advised that you should keep things at least 30°C (86°F) under the stated temperature. For instance, suppose the T Junction value is 100°C (212°F). So, you have to ensure that the CPU temperature does not cross over beyond 70°C (176°F).
What is a Good CPU Temp For Gaming?
For gaming, the temperature should be between 65-85°C (149–185°F). The average temperatures above 85°C (185°F) are good to go for some minutes of gameplay or other intense uses of CPU. But it should not be for an extended period of time, though your system is special for gaming. At the time of the most intensive parts, core temps hover around 80°C (176°F).
How To Prevent CPU Overheating:
It is important to prevent overheating in order to keep the PC running smoothly. Have you noticed your CPU cannot keep its temperature under control anymore or is finding challenges to doing this? Then, you should follow these steps to cool down this:
Keep Your Computer Clean: In order to remove dust from vents and fans, you need to clean the PC’s interior. Remember that dust buildup blocks overflow. As a result, temperature will be increased because of the absence of adequate cooling.
Improve Airflow: It is necessary to keep the hardware cool. Make sure that proper ventilation does exist in your computer. In addition, you must not block the air vents.
Use A Cooling Pad: Do you use a laptop? Then, you can improve airflow by using a cooling pad. It helps you to keep the computer cool.
Check Your Thermal Paste: This one is a kind of material applied between the heatsink and CPU with the purpose of improving heat transfer. Later, it can degrade or dry out. As a result, the effectiveness is reduced. So, you should check the thermal paste periodically. If you wish, you can even replace this.
Once you go through these steps, your CPU can run cooler with better efficiency.
How To Keep Down CPU Temperatures:
You can use these tips for cooling down your CPU temps:
Vacuum Your PC:
If you use an older laptop model, then clean out the fans by opening this up. Are you nervous about taking the cover off? In such cases, you are able to use compressed air dusters, allowing you to unclog your PC and CPU fan’s inner workings.
Use A Laptop Stand:
While it is used to lift the computer, you can place this vertically for more airflow. This stand has other advantages. Therefore, there is no need to check your CPU temperature continuously.
Keep Your Environment Cool:
You should not place your PC in heat or direct sunlight. Remember that you need to keep the ambient temperature as cool as you can. You must not leave your laptop turned on when you keep it in a laptop bag. Instead, you should try to set this to idle or sleep mode. Otherwise, you should turn off your laptop.
Replace Your Cooling Fan:
When you see that the fans inside the PC are unable to perform, you need to replace these with a more powerful cooler. Or you are able to install a water-cooling solution. When you plan to replace the fan, remove the processor, also. After that, you need to refresh the thermal paste. If necessary, you can replace this with a better one.
Keep Malware-free:
A few viruses can create constant CPU usage. It can increase the core load and the temperature. This is the reason you need to run a malware scan to detect malware and remove it from the computer. You can download a free antivirus for your Windows 10. If you want, run free malware scans.
Turn Off Background Applications And Close Programs:
You can even use a dedicated tune-up tool. It helps to reduce the load on the system and to reduce the CPU temperature.
Adjust Your Power Settings:
The power settings of your PC might affect both temperature and performance. You can try to switch to a power setting optimized for performance, like “High Performance” or “Maximum Performance.”
Conclusion:
In order to keep the PC running smoothly, it is essential to monitor CPU temperature. When you see overheating in your PC, ensure that you check your thermal paste. In addition, you can close non-essential programs to reduce strain on the CPU. If the CPU is still running too hot, you need to upgrade or replace the cooling system.
Frequently Asked Questions
How do you check what processor you have?
If you want to check your processor in Windows 10, you need to type about it in the taskbar search box. After that, you have to click About Your PC. All the necessary information will be available next to the Processor.
Does Windows 10 show CPU temperature?
You won’t find any option to check CPU temperature in Windows 10. Checking it can only be possible in BIOS. Otherwise, you may use third-party applications.
How hot should your CPU get?
The safe temperature for CPUs mostly ranges between 40–65°C (or 104–149°F).
The CPU is responsible for processing all the data and for managing all your commands and operations. Due to all the brain-work that a CPU is responsible for, it sometimes gets heated up. Now, if your CPU runs too hot for a very long time, it may cause you a lot of trouble, including sudden shutdown, system crash or even a CPU failure. While the CPU’s ideal temperature is room temperature, a little higher temperature is still acceptable for a short time period. Don’t fret, and the CPU can be cooled down by adjusting fan speeds using Fan Speed Controller Software. But, how would you, in the first place, find out how hot your CPU actually is? So, there are a few “thermometers” for your CPU. Let us see two of such apps, which will tell you what exactly your CPU’s temperature is.

Table of Contents
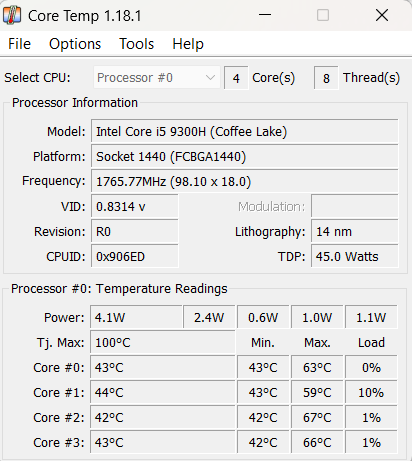
Core Temp: Monitor Your Computer’s CPU Temperature
Core Temp is the basic CPU temperature monitoring app that is available for free. It is a lightweight app that enables you to monitor the temperature of each core, and the temperature variations can be seen in real-time. You can download it from alcpu website. To use core temp,
1. Download Core Temp from the given site.
2. Launch the downloaded file to install it. Make sure that you uncheck any option to download other extra software with it.
3. Once installed, you will be able to see the different core temperature in your system tray. To see them, click on the upward arrow on your taskbar.
4. You will see as many temperatures as the total number of the core of all the processors in your system.
5. Right-click on any temperature and click on Show/Hide to show or hide the details.
6. The Show option will open a new window where you will see more information about your CPU like the model, platform, etc. For every individual core, you will see its maximum and minimum temperatures, which will keep on changing as you use different programs and applications.
7. At the bottom of this window, you will find a value named ‘Tj. Max’. This value is the maximum temperature limit that your CPU shall reach. Ideally, the actual CPU temperature should be lower than this value.
8. You can also customize its settings as per your needs. For that, click on ‘Options’ and then select ‘Settings’.
9. In the settings window, you will see several options like temperature polling/logging intervals, logging on startup, start with Windows, etc.
10. Under the ‘Display’ tab, you can customize the Core Temp display settings like field colours. You can also choose to view the temperature in Fahrenheit or hide taskbar button, among other options.
11. To customize what is visible at your notification area, move on to ‘Notification Area’ tab. Select if you want to see temperatures of all the cores individually or if you only require to see the maximum core temperature per processor.
12. Additionally, Core Temp has Overheat Protection feature to save you when your CPU is running too hot automatically. For this, click on ‘Options’ and select ‘Overheat protection’.
13. Check the ‘Enable overheat protection’ checkbox.

14. You can choose when you want to be notified and even decide if you want your system to be put to sleep, hibernate or shut down when a critical temperature is reached.
Note that Core Temp shows your core temperature and not CPU temperature. While CPU temperature is the actual temperature sensor, it tends to be more accurate at lower temperatures only. At higher temperatures, when the temperature is rather more critical to us, core temperature is a better metric.
HWMonitor: Check Your CPU Temperature in Windows 10
For those of you who need a better picture of your system temperatures, HWMonitor is an efficient app you should try. With HWMonitor, you can check temperatures of your CPU and your graphics card, motherboard, hard drives, etc. Just download it from this website. If you download the zip file, there is no need for installation. Just extract the files and double click on the .exe file to run it.

You will be able to see all the system details along with CPU temperatures. Note that HWMonitor shows both core temperature as well as CPU temperature.
What Temperatures are Safe?
Once you know your CPU’s temperature, you should know if it is safe for operation or not. While different processors have different permissible temperature limits, here are general approximate temperature ranges that you should know about.
- Below 30 degree Celsius: Your CPU is working too well.
- 30 degrees to 50 degrees: Your CPU is under ideal conditions (for a room temperature around 40 degree Celsius).
- 50 degrees to 60 degrees: This temperature is fine for slightly higher room temperatures.
- 60 degrees to 80 degrees: For load temperatures, anything below 80 degrees works fine. However, you should be warned if the temperature is continuously increasing.
- 80 degrees to 90 degrees: At these temperatures, you should be concerned. CPU running too long at these temperatures should be avoided. Look out for reasons like overclocking, dust build-up and faulty fans.
- Above 90 degrees: These are extremely dangerous temperatures, and you should consider shutting down your system.
How to keep the Processor cool?
The processor performs best when it is cool. To ensure your processor stays cool, consider the following:
- Keep your computer in a cool and ventilated environment while using it. You should ensure that it is not enclosed in tight and close spaces.
- Keep your system clean. Remove dust from time to time to allow efficient cooling.
- Verify if all the fans are working fine. Consider installing more fans if you really need to overclock or if your CPU turns quite hot frequently.
- Consider re-applying thermal paste, which allows heat to be transferred away from the processor.
- Re-install your CPU cooler.
Using the above-mentioned apps and methods, you can monitor or check your CPU temperature and prevent any trouble that high temperatures may cause. Apart from Core Temp and HWMonitor, there are many other apps that you can use to monitor CPU temperature like HWInfo, Open Hardware Monitor, etc.
Recommended:
- What is the Difference Between CC and BCC in an Email?
- Fix Cursor Jumps or moves randomly in Windows 10
- Set up Yahoo email account in Windows 10 Mail App
- Print Spooler Keeps Stopping? Here is how to fix it!
I hope this article was helpful and now you can easily Check Your CPU Temperature in Windows 10, but if you still have any questions regarding this tutorial then feel free to ask them in the comment’s section.
Table of contents
- Signs That Your PC’s CPU Is Overheating
- What Is a Normal CPU Temperature?
- Before Anything Else
- How to Check the CPU Temperature in the BIOS
- How to Check and Monitor the Temperature of the CPU Using First-party Apps
- Intel XTU
- AMD Ryzen Master
- AMD Software: Adrenalin Edition
- How to Check and Monitor the Temperature of the CPU Using Third-party Applications
- MSI Afterburner
- NZXT CAM
- Core Temp
- AIDA64 Extreme
- HWiNFO
- HWMonitor
- CPU Temperature Monitoring Apps: Comparison
- What to Do if Your PC Is Overheating?
- How to Check and Monitor the CPU Temperature on Your Windows 10/11 PC: Explained
- FAQ
Modern CPUs, or central processing units, perform billions of operations per second. Combine this with our growing love for multitasking (who doesn’t like to run a YouTube video in the background while browsing) and PC games becoming more and more demanding , and it’s no wonder why they still tend to overheat. While CPUs operate within safe temperature ranges most of the time, prolonged exposure to high temperatures can lead to system instability and , in most extreme cases, even physical damage. That’s why it’s also important to know how to monitor the CPU temperature in real time —to know your system better and be able to take timely measures to prevent overheating. In this guide, I’ll show you how to check the temperature of your CPU , talk about the reasons that can lead to your CPU running hot, and compare the CPU temperature monitoring tools so that you can choose one that fits your needs. And trust me, it’s not that hard.
Signs That Your PC’s CPU Is Overheating
Before anything else ,how do you tell if your CPU is operating outside its normal temperature? Here are a few common symptoms of an overheating computer :
- Lags and performance issues: If you notice a sudden decrease in your system’s performance, frequent lags, or delays in executing tasks, it could be a sign of CPU overheating.
- Unexpected shutdowns: Overheating may trigger your PC to shut down unexpectedly as a protective measure to prevent damage. If your computer regularly powers off without warning, overheating could be the cause.
- Loud fan noises: When the CPU temperature rises, cooling fans start working harder to dissipate heat. Unusually loud or continuous fan noises may indicate that your system is struggling to maintain a safe temperature.
While some of those may as well be signs of malware , chances are that your processor needs help . Ok, that’s clear, but what is considered a normal CPU temp? We’re about to find out.
Download Auslogics Anti-Malware
Detects malware, spyware and viruses, then safely removes them from your PC to help keep it as secure as possible. The program is made to complement your main antivirus.
What Is a Normal CPU Temperature?
Well, it depends on the processor model and the tasks you’re throwing at it . A safe, optimal CPU temperature range for most Intel and AMD processors is between 40°C (104°F) and 70°C (158°F) under normal workloads. However, more intensive tasks, like gaming or video rendering, may push this range to 70°C–80°C (158°F–176°F) .
Not sure what CPU you have? Check out this guide:How to Check What CPU Do I Have on My Windows PC?
When under load, Intel processors tend to run hotter, as they are known for pushing higher clock speeds and consuming more power. Their maximum operating temperatures (Tjmax) can reach up to 100°C (212°F). AMD processors , designed for better power efficiency, typically run cooler, with temperatures generally peaking at around 95°C (203°F). These figures can vary based on specific models and cooling setups, so monitoring your CPU temperature is key. What is a good CPU temp by processor family?
| Processor family | Normal operating temp (idle/load) | Tjmax (max operating temp) |
|---|---|---|
| Intel Core (i3-i9) | 30°C–80°C (86°F–176°F) | 100°C (212°F) |
| Intel Xeon | 30°C–70°C (86°F–158°F) | 85°C (185°F) |
| AMD Ryzen (Ryzen 3-Ryzen 9) | 30°C–80°C (86°F–176°F) | 95°C (203°F) |
Upon reaching and passing Tjmax, CPU throttling occurs, reducing the voltage on your processor to lower the temperature and prevent overheating. Also remember that prolonged operation at temperatures over 80°C–85°C (176°F–185°F) can affect your CPU lifespan, degrade performance, and lead to system instability.
What is a normal CPU temperature during gaming?
While the exact figures can vary depending on factors like the specific processor model, cooling solution, and the intensity of the game being played, generally, a CPU temperature range between 65°C (149 °F ) and 85°C (185 °F ) during games is considered safe.
High-end gaming setups with robust cooling solutions may keep temperatures towards the lower end of this range, while less powerful systems or those in demanding gaming scenarios may experience temperatures closer to the upper limit.
That said, you shouldn’t neglect monitoring your CPU temperature while playing, and remember that sustained temperatures above the safe range could lead to long-term damage.
Before Anything Else
The CPU is the powerhouse behind your computer’s operations. Even if you’re not mining crypto or making it perform endless AI-related calculations per second, there are still a number of more conventional ways to warm up your processor; one of them is gaming.
Although modern games generally rely more heavily on the GPU than the CPU, there are a few, such as Star Citizen, Total War: Warhammer 2, and Cyberpunk 2077 , which, along with video editing and decoding software, are among the most CPU-intensive tasks for your PC.
Additionally, as a PC or laptop ages , the thermal paste wears out and its components start producing more heat, meaning the older it gets, the harder it is to cool the processor.
With that in mind, it’s important to know how to check the temperature of your CPU when running resource-demanding operations or hearing loud fan noises and monitor it to ensure your processor performs well and stays within safe temperature ranges.
But before anything else, it’s worth checking if high CPU temperature is caused by increased processor workload in Task Manager.
It’s quite easy; simply follow these steps:
- Right-click anywhere on the taskbar and select Task Manager .
- Go to the Performance tab and select CPU.
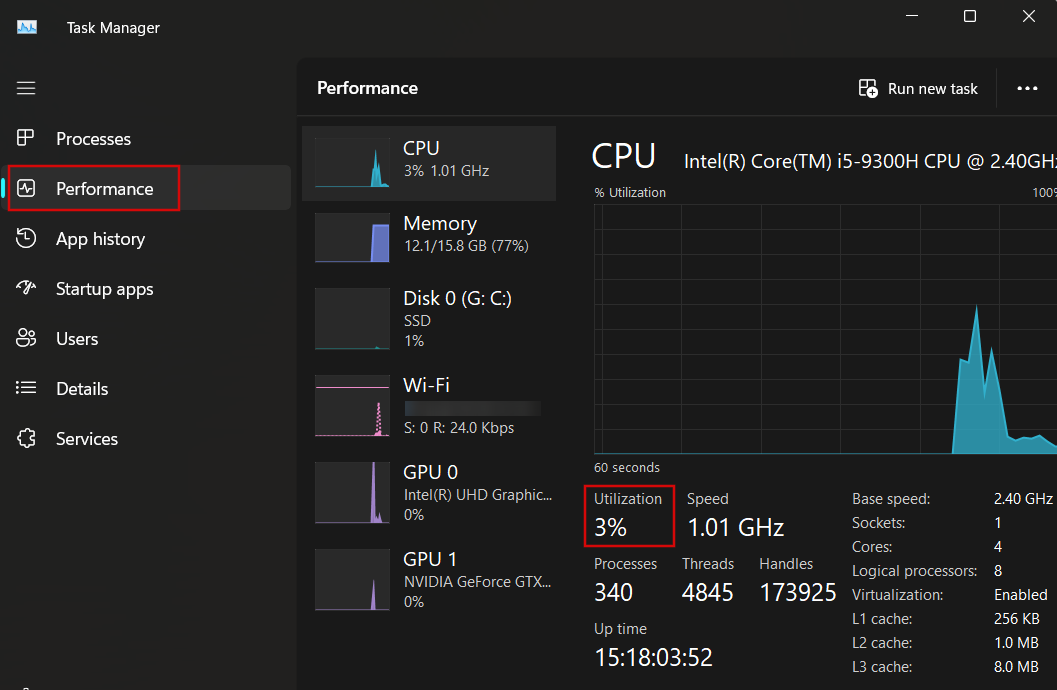
Now, look at the figures under the graph. If you notice sustained CPU utilization of 90% and higher , it could well be the reason for increased heat generation . Consider stopping unnecessary apps from running in the background to reduce the load on your processor.
Now, let’s explore how to check your PC temperature using the BIOS and how to monitor it using more feature-rich solutions.
How to Check the CPU Temperature in the BIOS
If you want to see the CPU temp in Windows 11 or 10 without installing any apps, you can do that in the BIOS. Here’s how:
- Save any ongoing work and restart your computer.
- During the boot-up process, press the designated key to enter the BIOS . Depending on your computer’s manufacturer, it would commonly be
F2, F10, F12, ESC,orDEL. - Once inside the BIOS interface, navigate to the section that contains hardware information. This is often labeled as Hardware Monitor , PC Health , or similar, depending on your motherboard manufacturer .
- Look for the CPU temperature reading labeled as CPU Temperature or something similar.
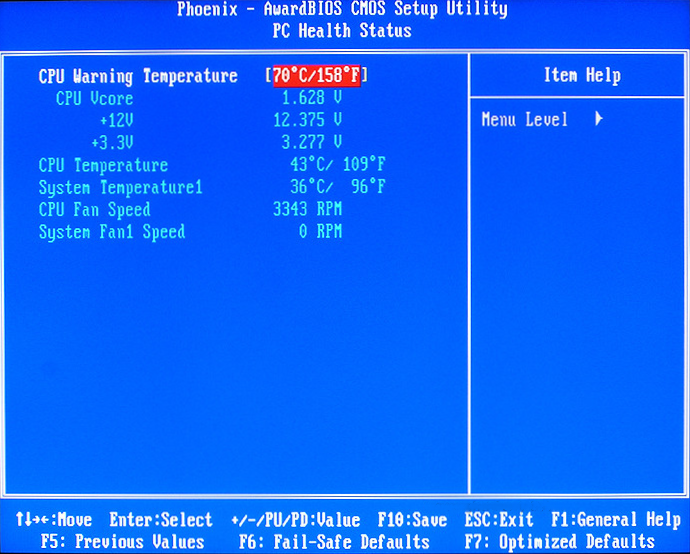
Image source: superuser.com
The BIOS interface doesn’t provide real-time temperature data like specialized apps, but only a snapshot of the current CPU temperature.
How to Check and Monitor the Temperature of the CPU Using First-party Apps
Unlike the BIOS, specialized applications allow you to not only check the current temperature of your CPU but to keep track of it in real-time. Some of them offer additional metrics , such as fan speed, GPU temperature, and system voltages. For starters, two major CPU manufacturers, Intel and AMD, have their own software tools that allow for checking and monitoring CPU temperature . So let’s first see what both companies have to offer. First of all, you need to identify your processor manufacturer . Here’s how to do it:
- Type
aboutin the taskbar search box and select About your PC.
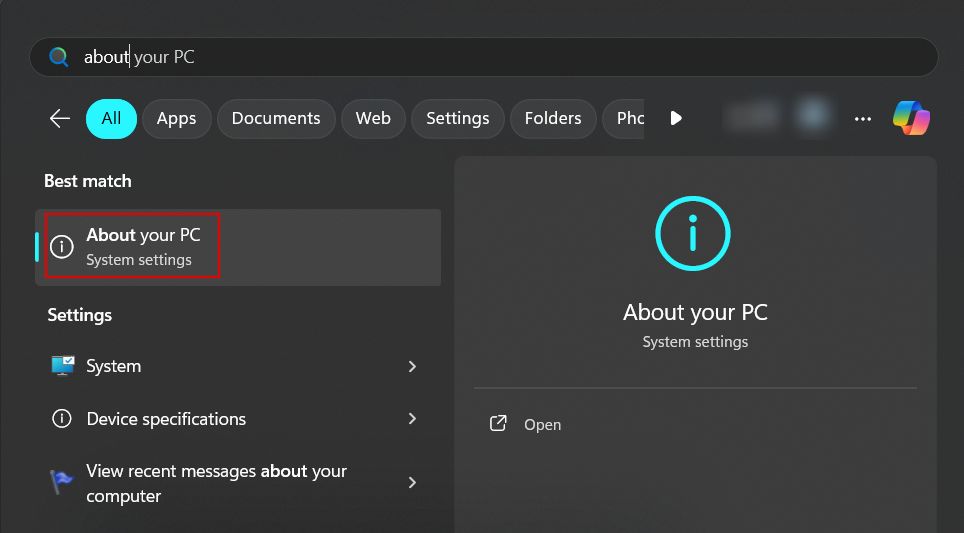
- Look for Processor under Device specifications on the right side to identify your CPU model.
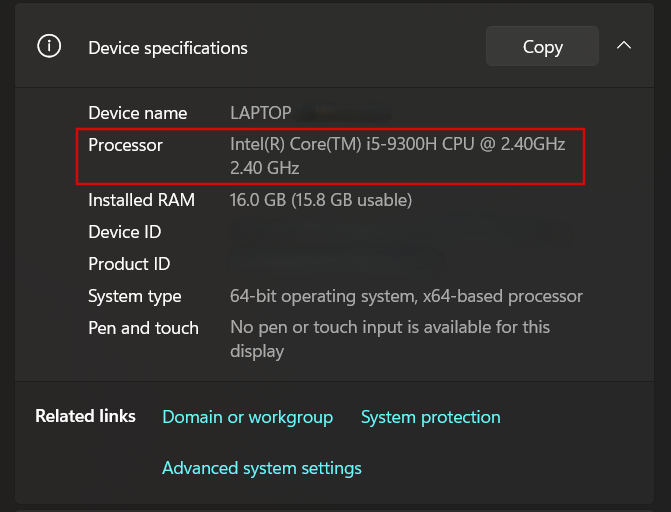
If it’s Intel, like mine, you need to use Intel Extreme Tuning Utility (or Intel XTU). If it’s AMD, then your choice is Ryzen Master or AMD Software: Adrenalin Edition that has an overlay feature.
Now, let’s take a closer look at how you can check and monitor the CPU temperature using these apps, and then check out the third-party solutions.
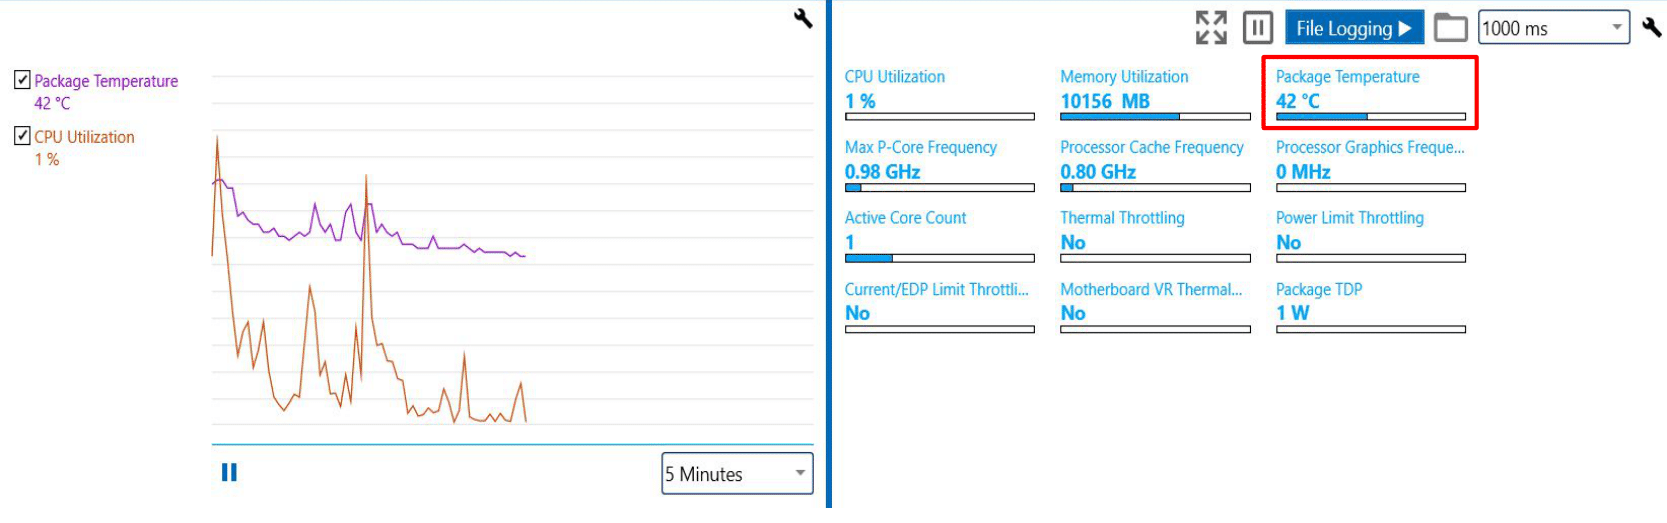
Intel XTU
Intel XTU not only allows you to check and monitor CPU temperature but also provides advanced options , such as tuning core ratios and adjusting voltages, if you’re in for overclocking or CPU undervolting .
How to use:
- Download and install Intel XTU , and open the app.
- The interface will provide you with various options for tuning, benchmarking, and monitoring your Intel processor.
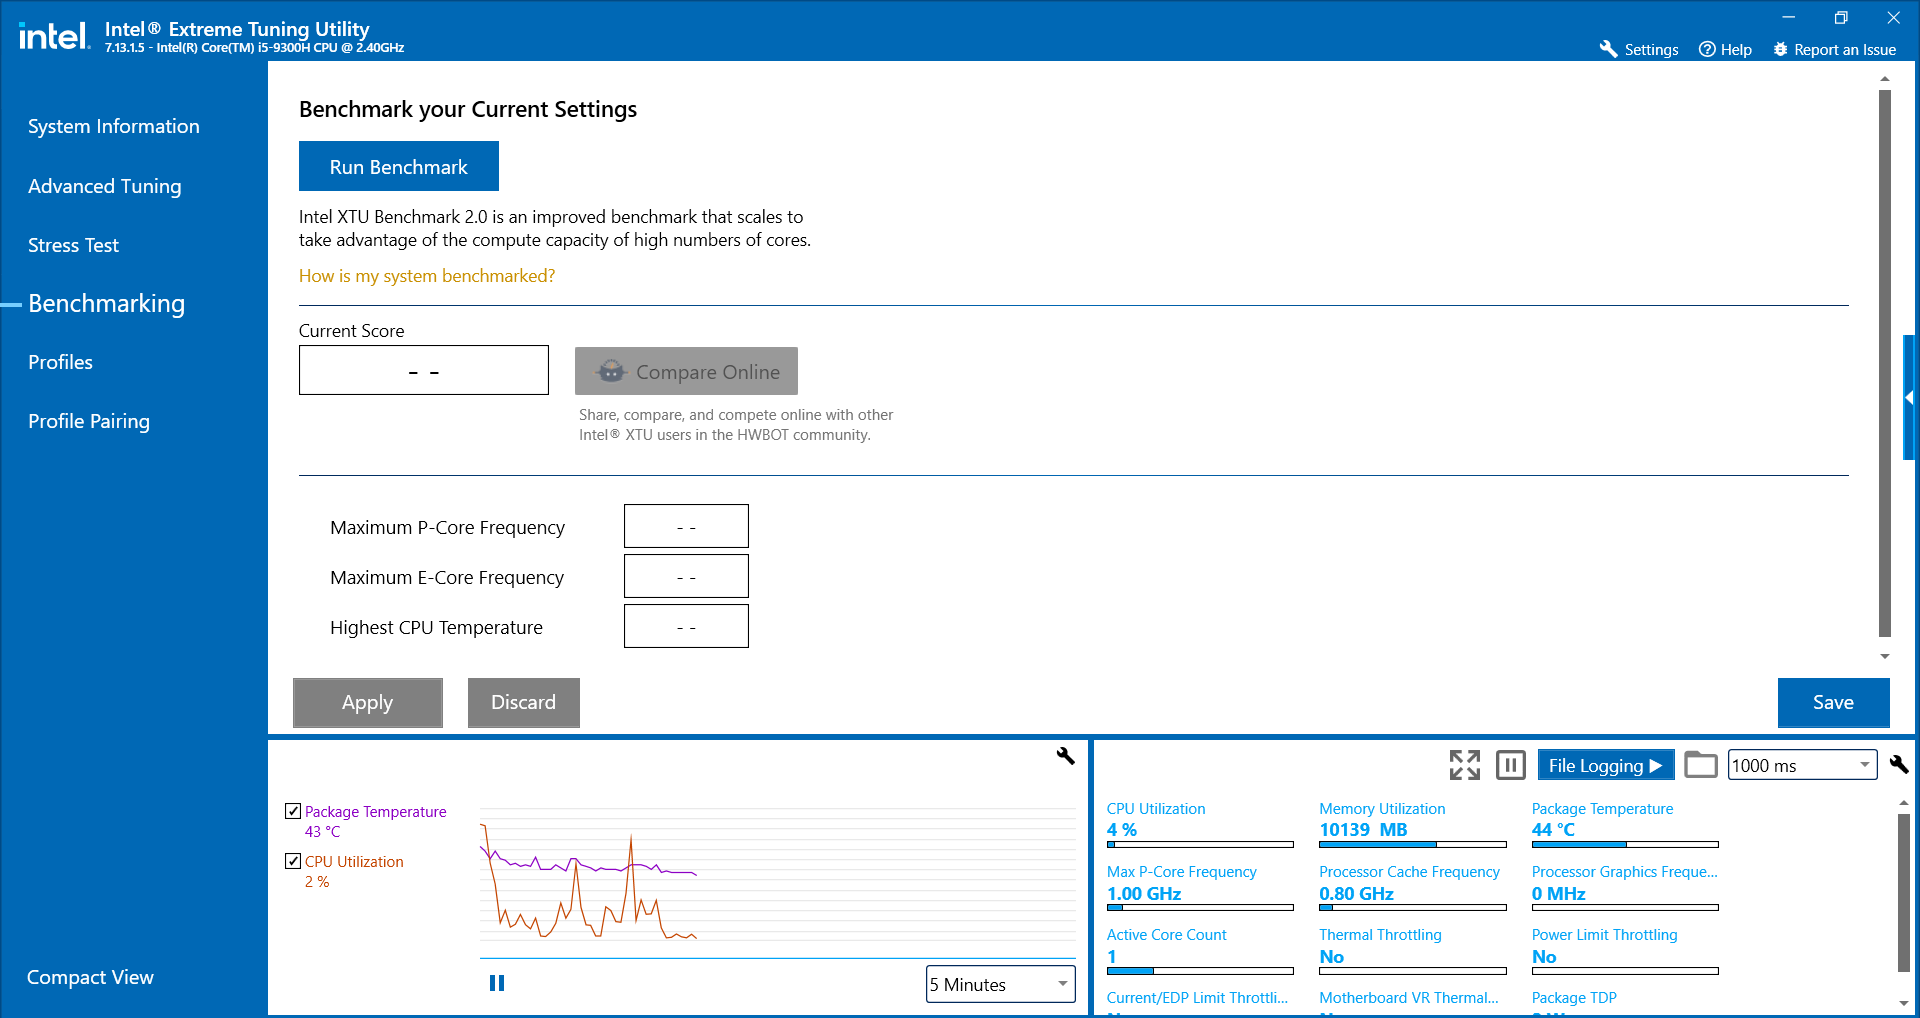
- While Intel XTU is primarily designed for overclocking and performance tuning, it allows you to monitor the CPU temperature in real time , among other performance indicators in the lower bar (shown as Package Temperature ).
Pros:
- Simple, easy-to-use interface
- Includes overclocking tools
Cons:
- Only works with Intel CPUs
- No overlay feature
Suitable for gaming:
No, Intel XTU doesn’t have an overlay feature to view your real-time CPU temperature. The only option is to run the app in the background in a separate window, but that’s not quite convenient.
What users say:
Users praise Intel XTU for its ease of use and overclocking capabilities but are quite skeptical about its benchmark tool .
AMD Ryzen Master
Ryzen Master’s interface, just like Intel’s, also offers additional metrics like CPU clock speed, voltage, and more, allowing for overclocking and undervolting.
How to use:
- Download and install Ryzen Master , and open the app .
- Look for Temperature on the left side of the app’s interface to see the current CPU temperature displayed in real time. Under the current temperature, you can see the maximum temperature for your processor.
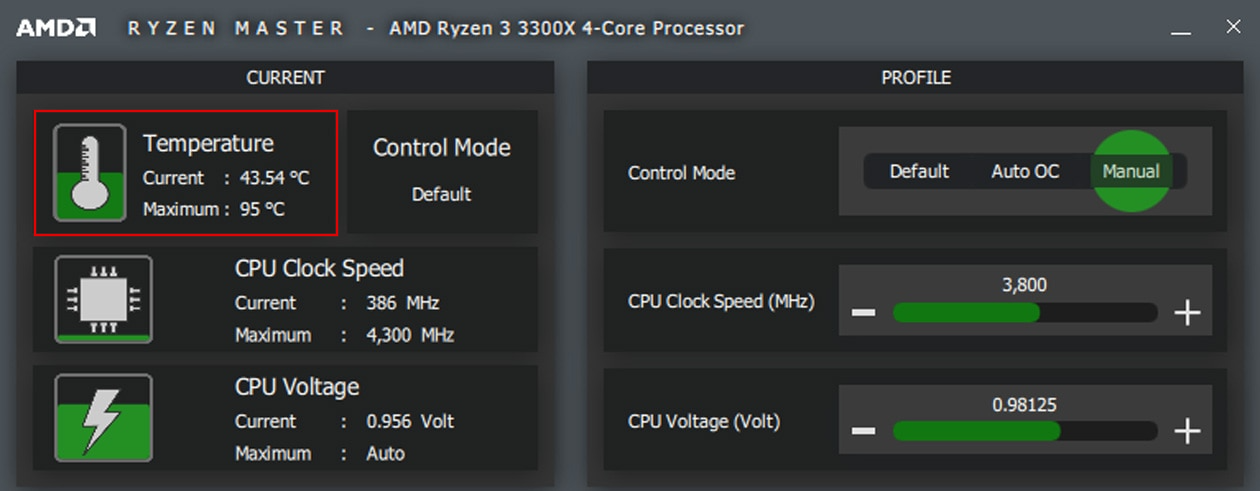
Image source: amd.com
Pros:
- Detailed monitoring and overclocking features
- User-friendly interface
Cons:
- Only supports Ryzen CPUs
- No overlay feature
Suitable for gaming:
No, just like Intel XTU, it doesn’t have an overlay feature to monitor the CPU temperature in real time.
What users say:
Most users on Reddit agree that AMD Ryzen Master is better used for monitoring and testing rather than overclocking. Plus, the app is reported to glitch from time to time, which can make it feel unreliable.
AMD offers different versions for Ryzen 3000 series CPUs and newer and Ryzen 2000 series and older. Make sure to download the right version for your processor.
Also read: How to Update AMD Drivers
Both apps allow you to check and monitor the CPU temperature to ensure it stays within safe operating limits and prevent overheating . But while you can keep them running in the background during gaming to monitor your CPU temperature and other metrics, none of them offers a convenient overlay.
Important!
With all the good stuff you can get from both Intel XTU and AMD Ryzen Master, it’s important to remember that they are primarily designed for overclocking and use them responsibly, avoiding extreme settings that could lead to overheating or instability.
AMD Software: Adrenalin Edition
AMD Software: Adrenalin Edition offers a user-friendly interface for monitoring AMD hardware, including the CPU and GPU. It provides real-time monitoring with an in-game overlay and additional features, such as fan speed control , built in.
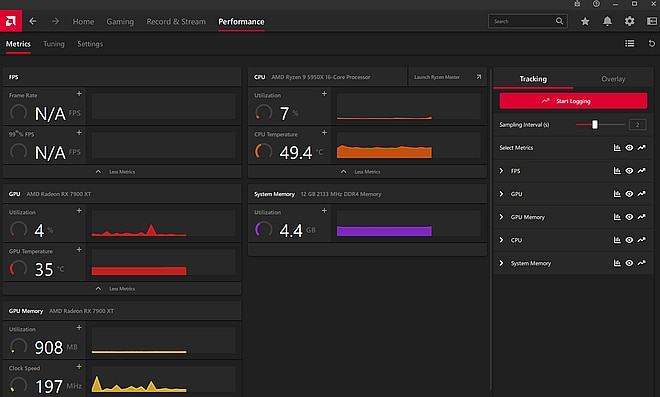
Image source: amd.com
How to use:
- Download and install AMD Software: Adrenalin Edition . On that page, you will need to select your graphics card from the list first to be able to download the app.
- Launch the app, and on the home screen, click on the Performance tab.
- Here, you can view CPU and GPU temperatures, fan speeds, and other performance data in real time.
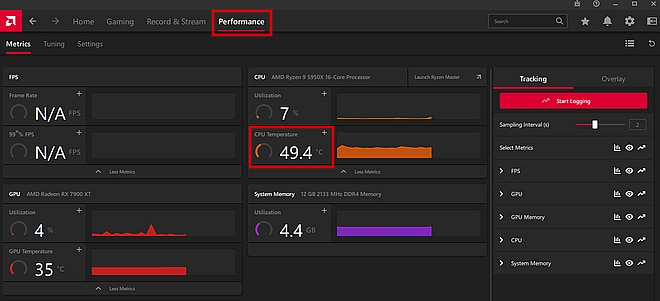
Image source: amd.com
- To launch the overlay feature, click on Overlay in the right-side pane, enable the CPU Temp metric gauge, and toggle the Show Metrics Overlay option.
Images source: amd.com
Pros:
- Simple and intuitive interface
- Built-in optimization tools for both CPU and GPU
- In-game overlay for real-time CPU temperature monitoring
Cons:
- Only available for AMD hardware
- Limited customization compared to other tools
Suitable for gaming:
Yes, with the in-game overlay feature, AMD Software: Adrenalin Edition allows you to monitor CPU temperature and other key metrics while gaming.
What users say:
Users appreciate the app’s ease of use and integration with AMD hardware, but some mention that its overlay function is negatively affecting FPS , which is not good for gaming.
Also read: How to Check and Increase FPS on a Windows PC
AMD Software: Adrenalin Edition is compatible with AMD Ryzen processors with Radeon graphics, AMD Ryzen PRO processors, AMD Athlon processors with Radeon graphics, and AMD Athlon PRO processors.
Just like the previous two apps, AMD Software: Adrenalin Edition is mostly designed for overclocking, but its overlay feature makes it more suitable for keeping tabs on your processor’s current temperature during various tasks.
In the next section, I’ll be showing you how to check and monitor the computer temperature using third-party monitoring tools .
How to Check and Monitor the Temperature of the CPU Using Third-party Applications
Now that we know that processor manufacturers offer specialized tools that are quite “heavy” for simple CPU temperature monitoring and more suited for overclocking, let’s go over some third-party apps that may make this process easier.
MSI Afterburner
This highly customizable tool is perfect if you want real-time temperature monitoring for both CPU and GPU. However, its complex interface can be challenging for beginners.
How to use:
- Download and install MSI Afterburner . During the installation, you will be prompted to install RivaTuner as well. Do that, otherwise you won’t be able to run the overlay with real-time CPU temperature data.
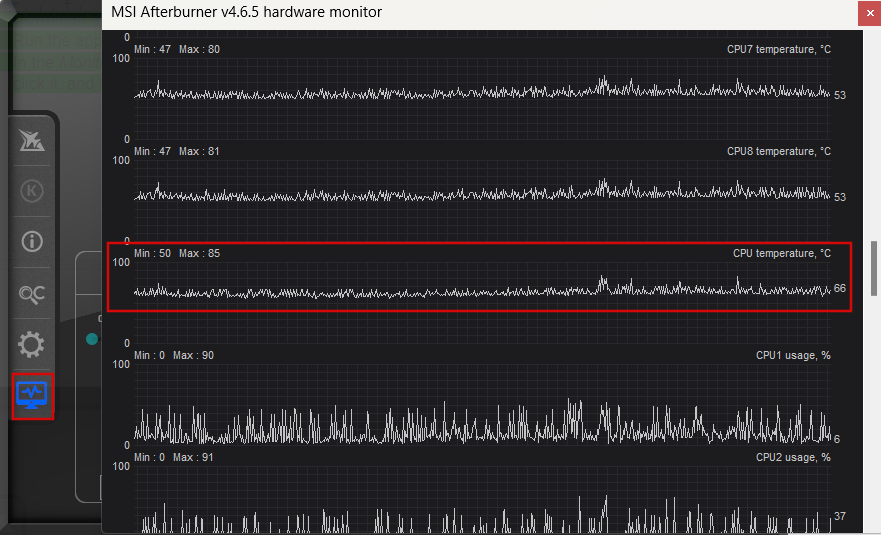
- Run the app and click the button that looks like a monitor on the left side of the app window. This will launch the hardware monitor, where you can track all sorts of metrics, including the CPU temperature, in real time.
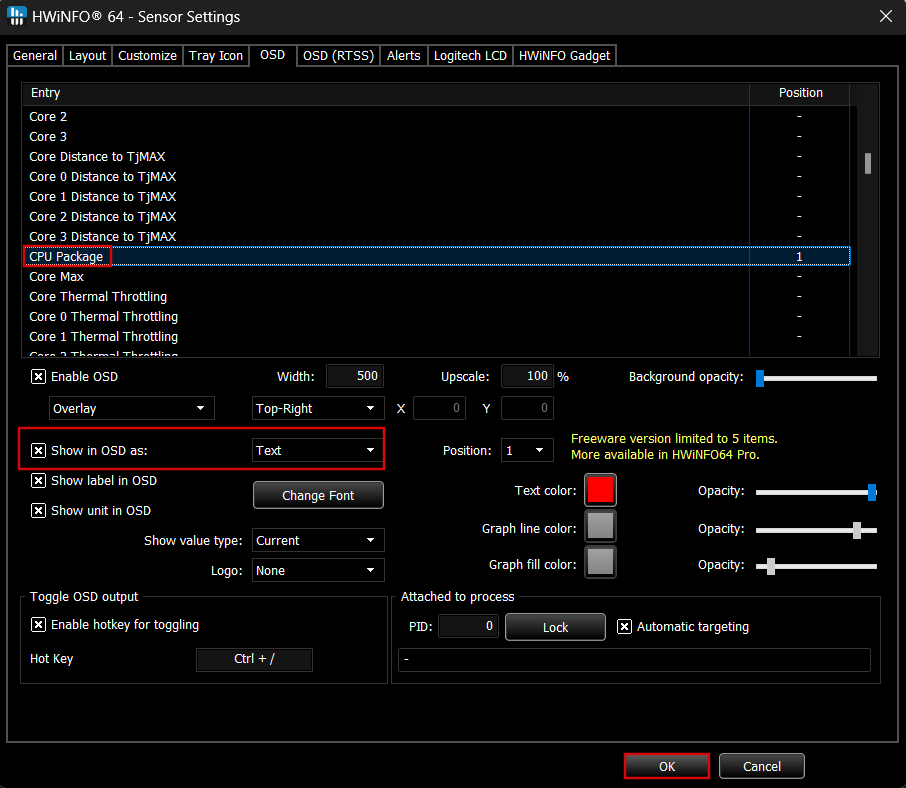
- To launch the overlay and monitor the CPU temperature during gaming or while using certain apps, click on the gear-shaped button in the main window and go to the Monitoring tab.
- Locate CPU temperature under Active hardware monitoring graphs, click it, and then check the Show in On-Screen Display box.
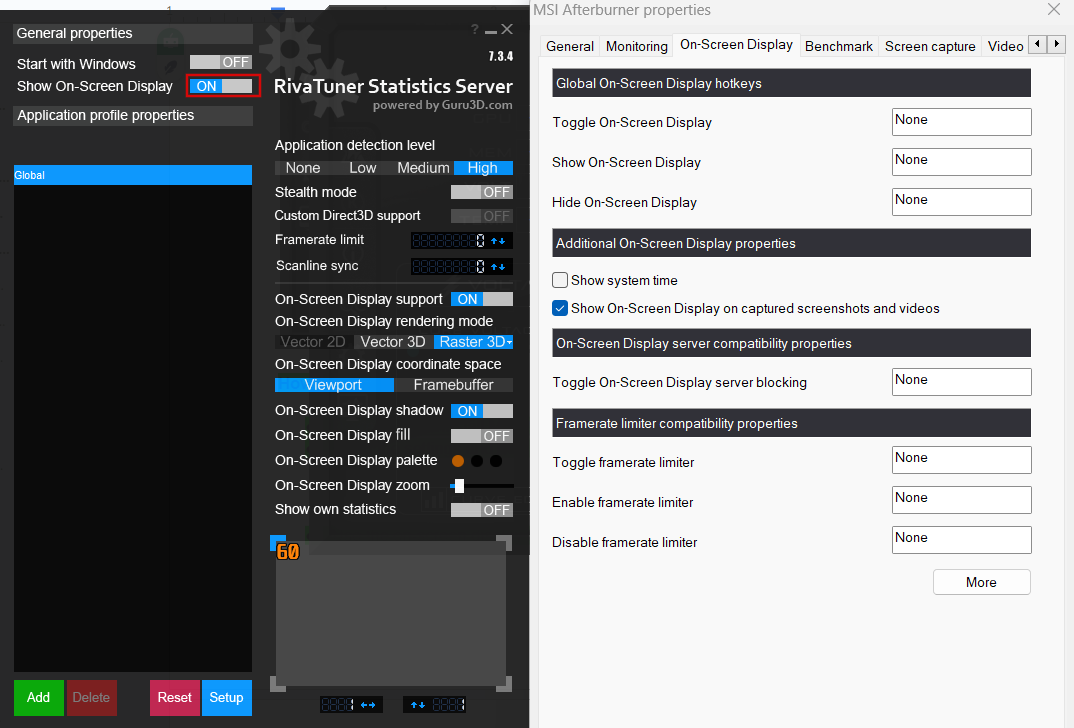
- Then, go to the On-Screen Display tab, click More in the bottom of the window, and make sure the Show On-Screen Display button under General properties is switched on. You can also customize the looks of this on-screen display here.
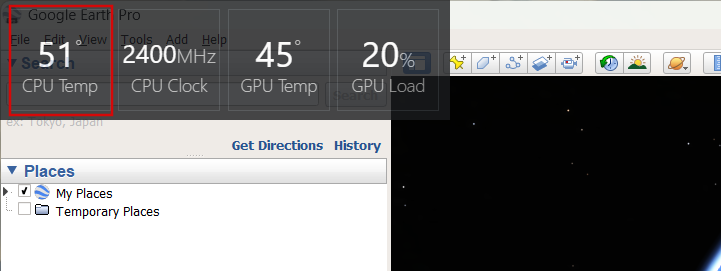
- You can now monitor the CPU temperature in games and apps in real time. It will be displayed in the upper left corner of the game or app window.
Pros:
- Highly customizable
- Supports both GPU and CPU monitoring
- Features the on-screen display for real-time tracking
Cons:
- Can be overwhelming for beginners due to its complex interface
Suitable for gaming:
Yes, MSI Afterburner is great for gaming as it offers an in-game overlay that shows real-time temperature monitoring for both CPU and GPU.
What users say:
Generally, MSI Afterburner gets positive reviews on Reddit and is recommended by users as a reliable and trustworthy solution to monitor the CPU temperature with a convenient overlay feature.
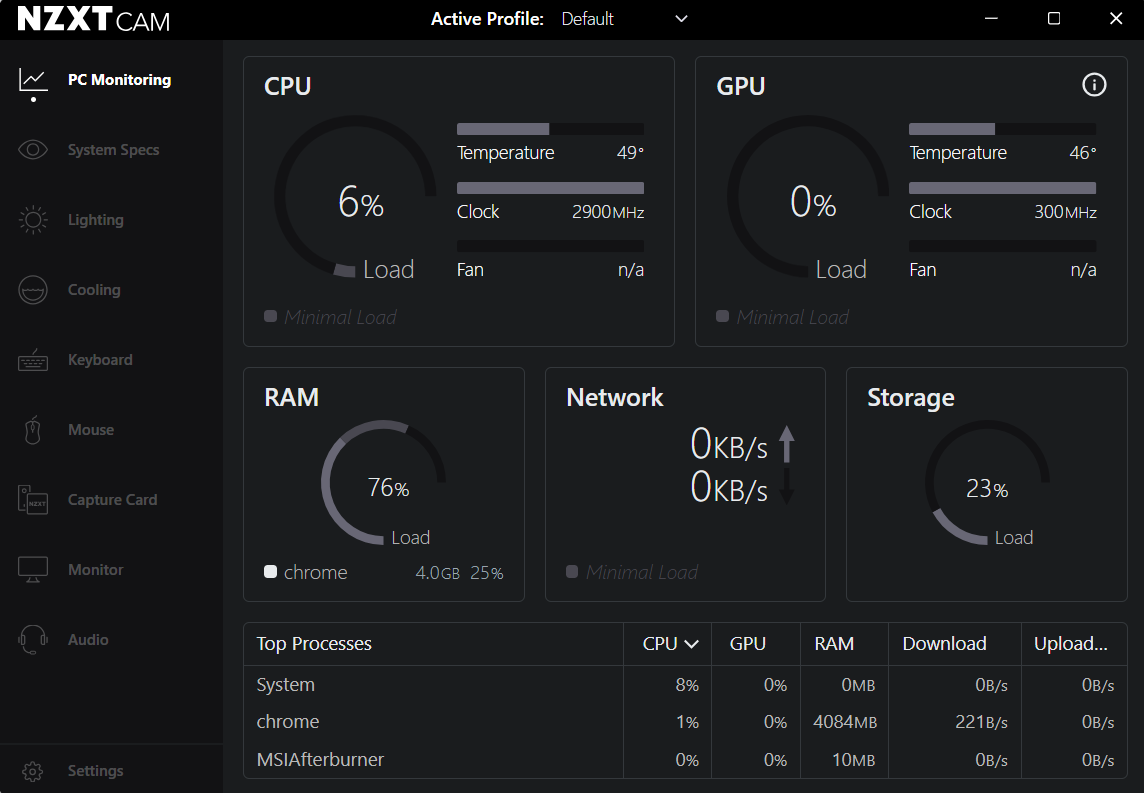
NZXT CAM
NZXT CAM nicely balances simplicity and functionality. The app features all the necessary tools for CPU monitoring, such as temperature, clock speed, and load. And it looks cool, too!
How to use:
- Download and install NZXT CAM .
- Launch the app and monitor CPU temps right from the dashboard or click on the CPU window to open the CPU Details window and get more info on your processor.
- To launch the overlay and monitor the CPU temperature during gaming, go to Settings > Mini Mode . Scroll down and make sure the CPU Temperature box is checked under Panels .
- Scroll back up and click Launch Mini Mode in the upper right corner of the window.
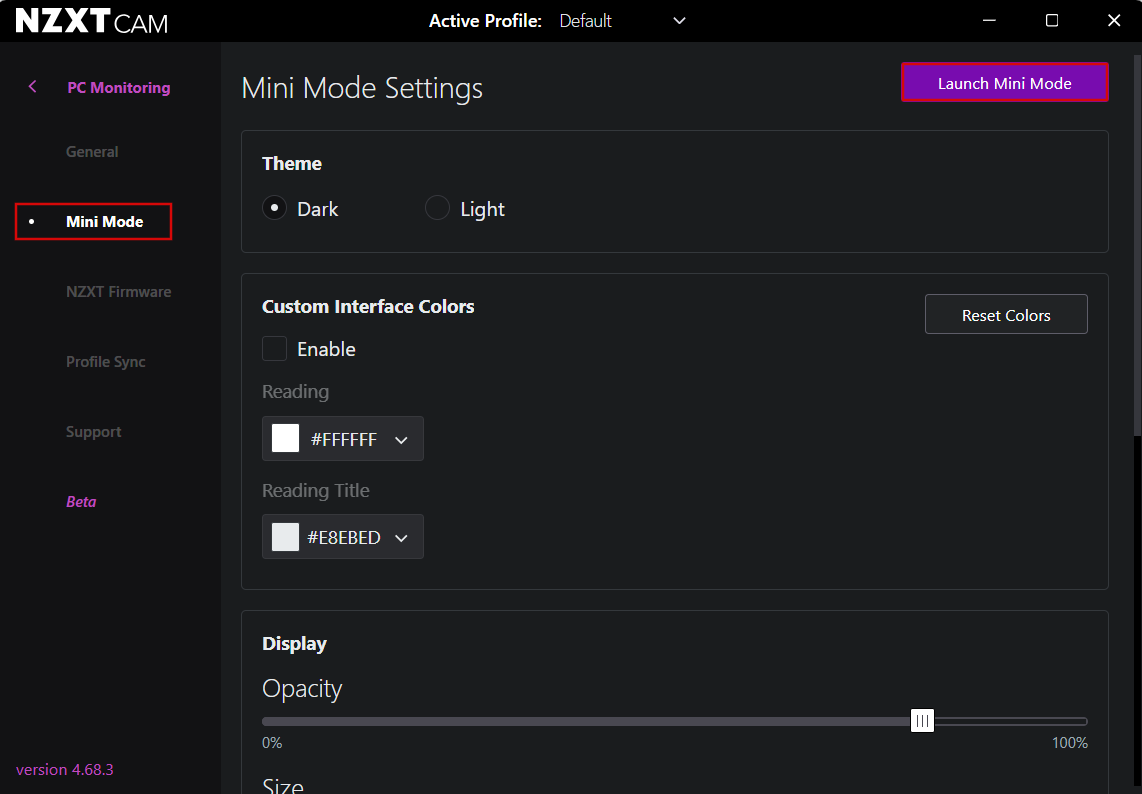
- The CPU temperature will be displayed in a transparent window in the upper left corner of the screen.
Pros:
- Sleek, intuitive interface
- Multi-hardware support (CPU, GPU, etc.)
- Game overlay feature
Cons:
- Large size (over 450MB)
- Some users report inaccurate readings
Suitable for gaming:
Yes, the Mini Mode feature that shows the CPU temperature and other metrics during gameplay makes NZXT CAM a decent pick for gamers.
What users say:
Despite NZXT CAM’s nice-looking design and ease of use, user reviews on Trustpilot are far from complimenting. In general, people are quite unhappy with the app’s performance and the customer support.
Core Temp
Core Temp is a lightweight, no-frills app that displays your CPU temperatures instantly, making it a solid choice for basic monitoring. While it’s simple and efficient, it lacks advanced features like overlays.
How to use:
- Download and install Core Temp .
- Open the app to view CPU temperatures instantly in the app or in the system tray (click Show hidden items), which will show the temperature of each CPU core.
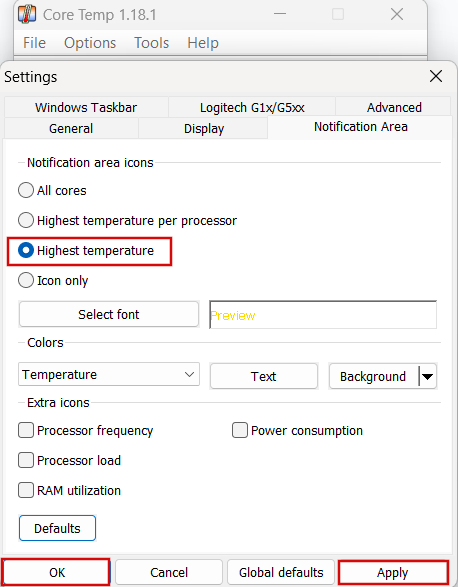
If you don’t need to view all cores, you can instruct the app to display only the hottest one. Simply go to Options > Settings > Notification Area and click on the Highest temperature radio button under Notification area icons . Don’t forget to click on Apply and OK to save changes.
Pros:
- Lightweight and resource-efficient
- Simple and straightforward to use
Cons:
- Lacks overlays
- Basic functionality without additional performance stats
Suitable for gaming:
No, Core Temp does not have in-game monitoring features, so you cannot track temperatures while gaming.
What users say:
Generally, Core Temp has positive references from the users and is praised for its reliability and ease of use.
AIDA64 Extreme
Known for its in-depth hardware analysis, AIDA64 Extreme is ideal for advanced users who not only require detailed CPU temperature data but also for benchmarking and overclocking. The free version has its limitations, but it’s still a reliable option for serious hardware enthusiasts.
How to use:
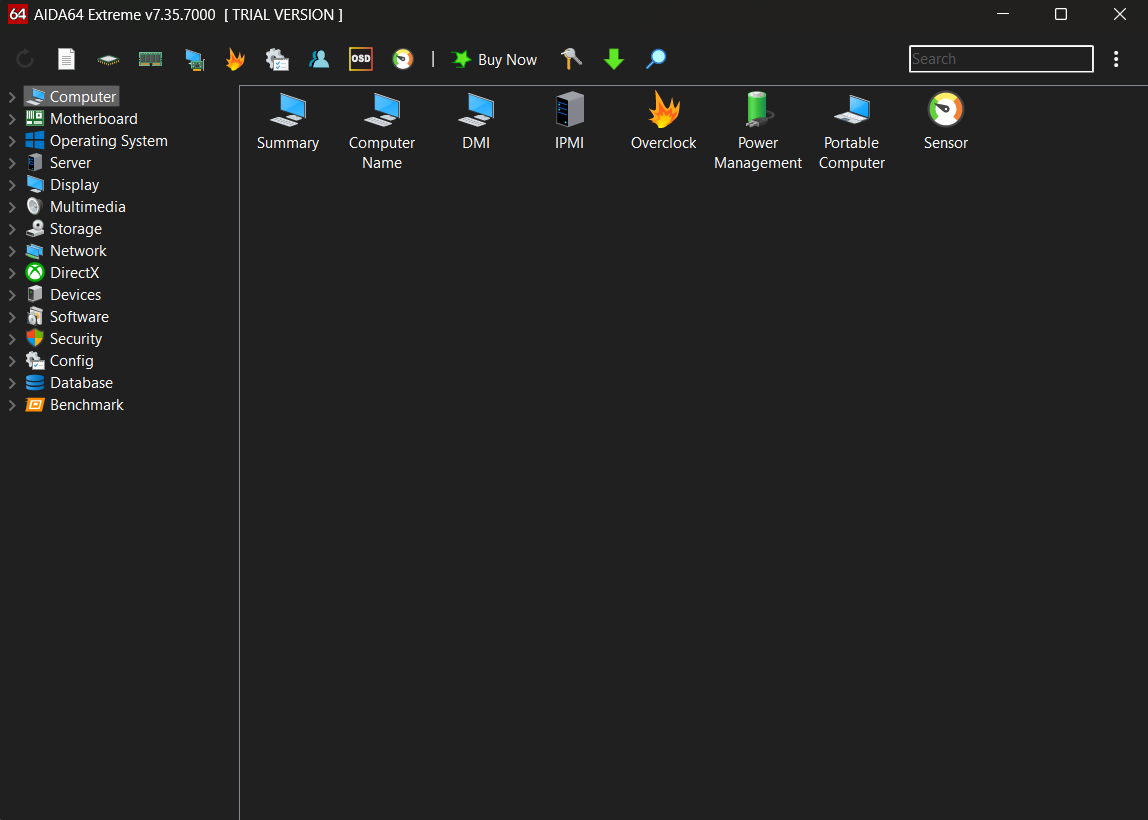
- Download and install AIDA64 .
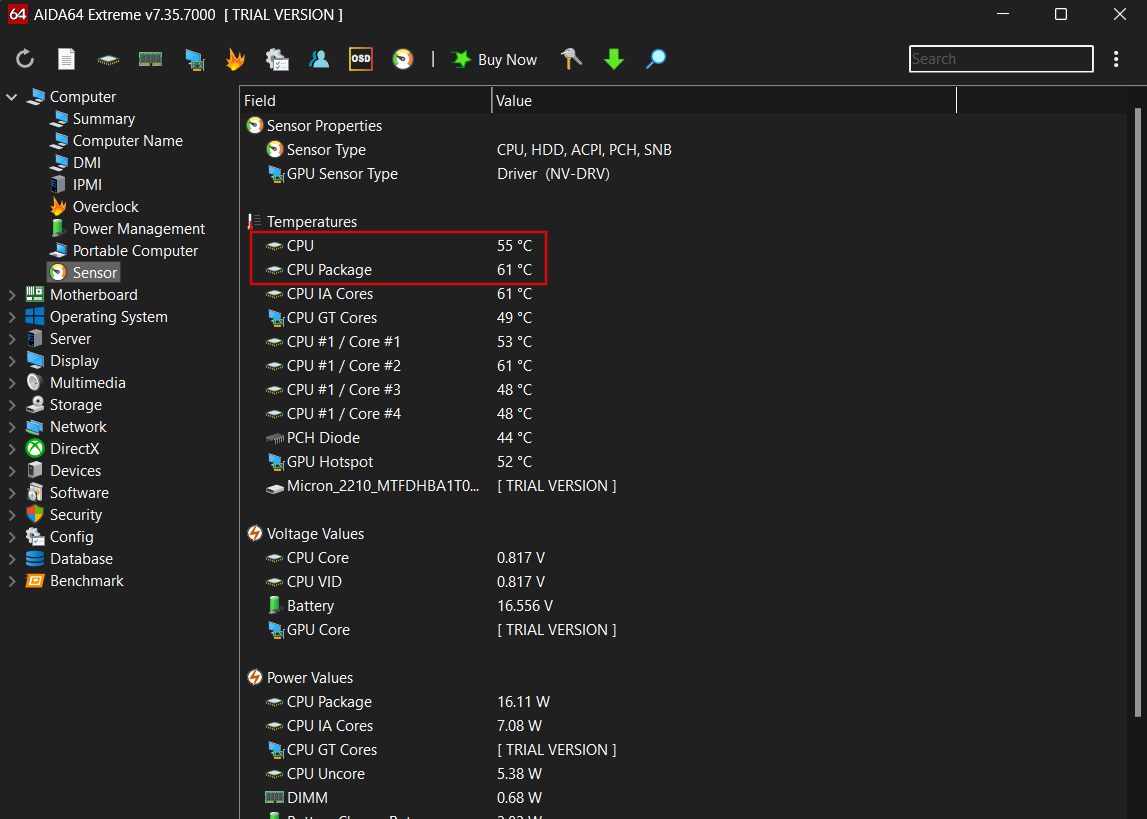
- Open the app and click Sensor.
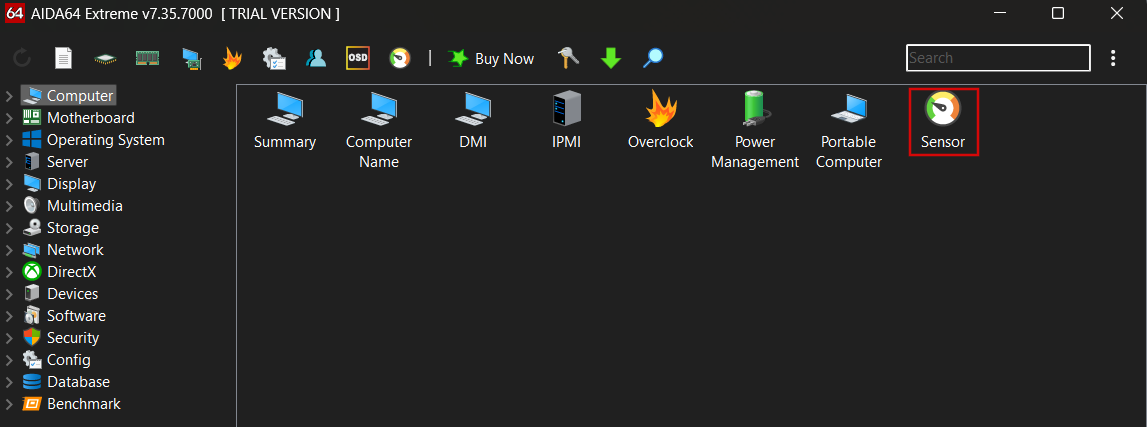
- The CPU temperature will be displayed under Temperatures , along with other readings.
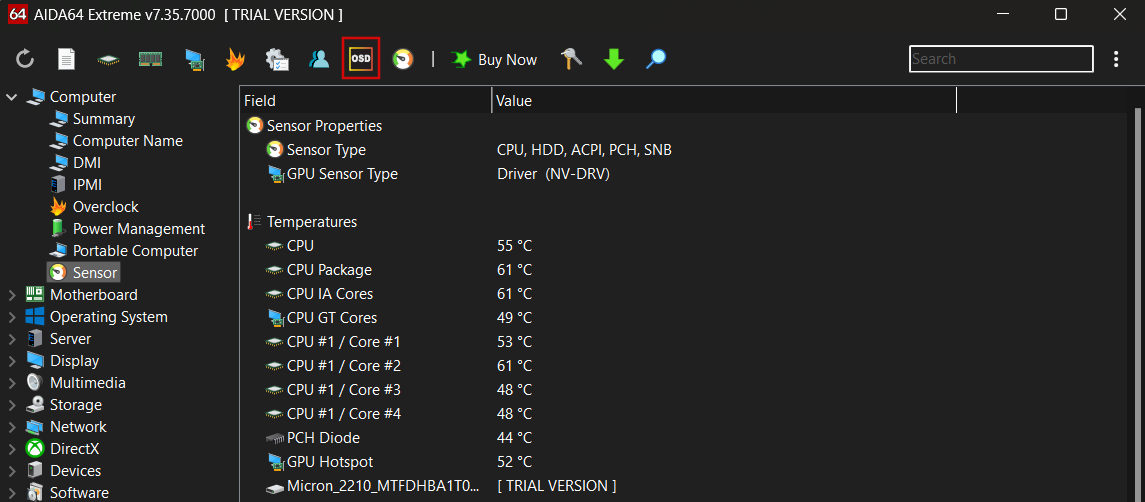
- To launch the overlay, click on the OSD icon in the upper menu.
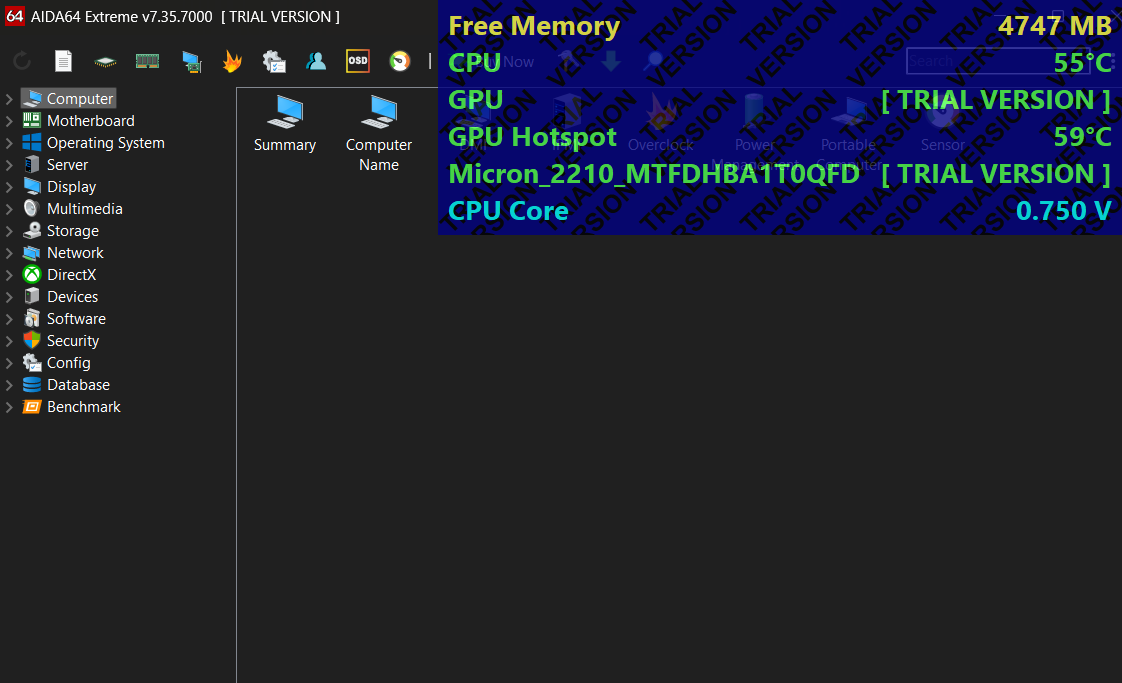
- You can now play and monitor your CPU temperature and other metrics in real time.
Pros:
- Provides extensive hardware details
- Ideal for advanced users needing in-depth analysis
Cons:
- Can be too much for simple CPU temperature monitoring
- Free version limited to 30 days
Suitable for gaming:
Yes, AIDA64 Extreme offers temperature monitoring that can be used during gaming.
What users say:
AIDA64 Extreme gets high marks and good references from users for its usefulness and customization options, even despite a learning curve that might be a bit steep for less experienced users.
HWiNFO
HWiNFO delivers incredibly detailed monitoring; however, its detailed interface can be a bit overwhelming if you’re only looking for CPU temperature metrics.
How to use:
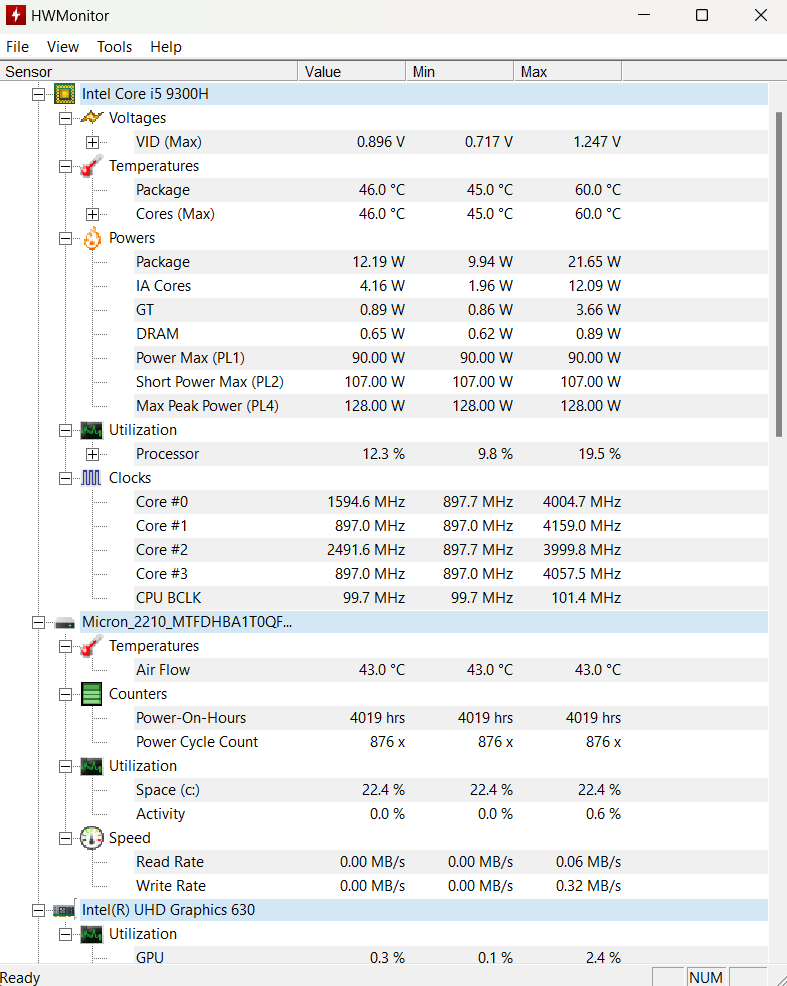
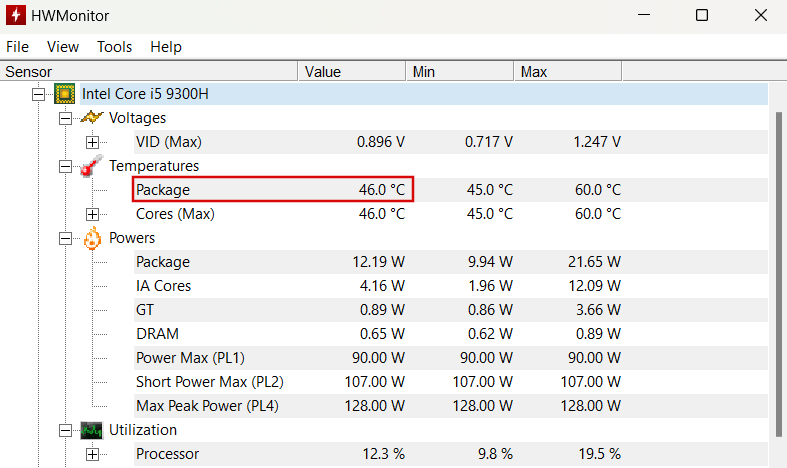
- Download and install HWiNFO .
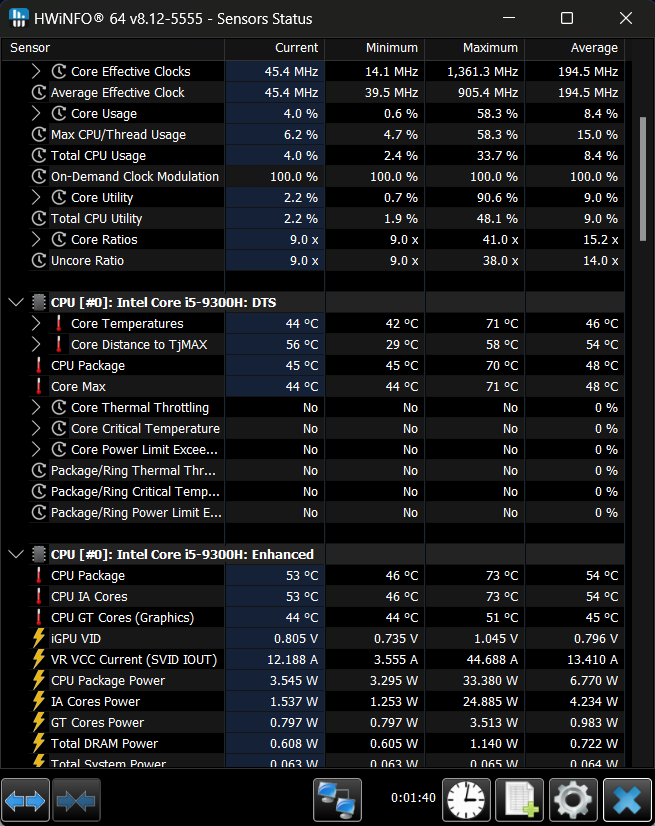
- Open the app, tick the Sensors-only box, and click Start.
- Scroll down to your CPU and locate CPU Package . This is the CPU temperature to monitor.