
Все способы:
- Варианты открытия DMP
- Способ 1: BlueScreenView
- Способ 2: Microsoft Debugging Tools for Windows
- Заключение
- Вопросы и ответы: 2
Активные пользователи ОС семейства Windows часто сталкиваются с файлами в формате DMP, потому сегодня мы хотим познакомить вас с приложениями, способными открывать такие файлы.
Варианты открытия DMP
Расширение DMP зарезервировано за файлами дампов памяти: снимков состояния RAM в определённый момент работы системы или отдельного приложения, которые нужны разработчикам для последующей отладки. Такой формат используют сотни видов ПО, и рассмотреть их все в объёмах данной статьи невозможно. Наиболее же часто встречающийся тип DMP-документа – так называемый малый дамп памяти, где записаны подробности сбоя системы, который привёл к появлению синего экрана смерти, потому на нём и сосредоточимся.
Способ 1: BlueScreenView
Небольшая бесплатная утилита от разработчика-энтузиаста, основной функцией которой является предоставление возможности просмотра DMP-файлов. Не нуждается в установке на компьютер – достаточно распаковать архив в любое подходящее место.
Загрузить BlueScreenView с официального сайта
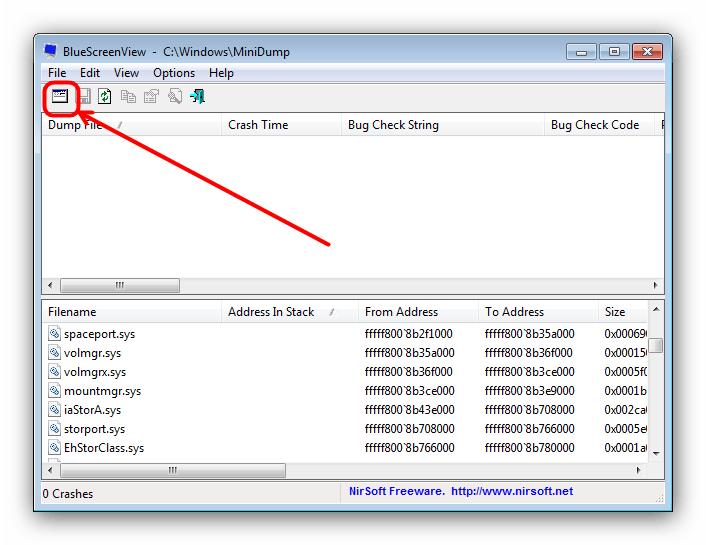
- Для открытия отдельного файла нажмите на кнопку с иконкой программы на панели инструментов.
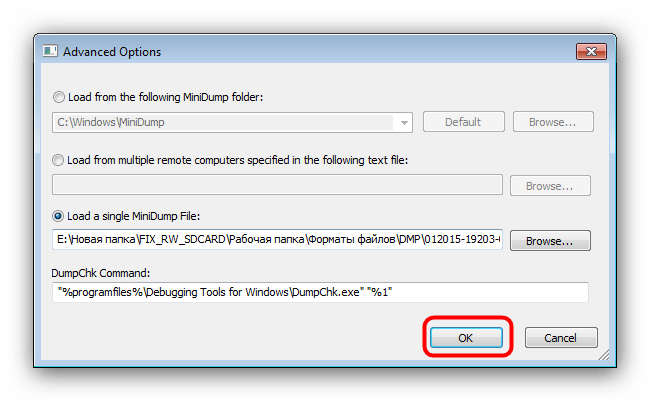
- В окне «Advanced Options» отметьте чекбокс «Load a single Minidump File» и нажмите «Browse».
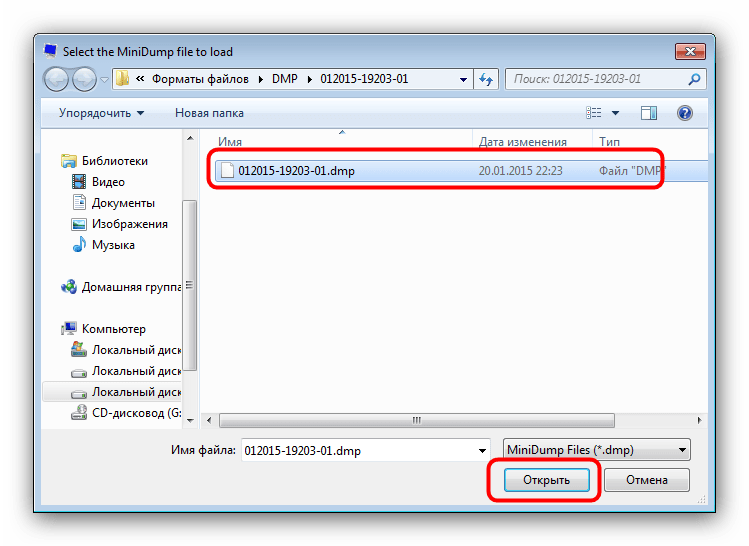
- С помощью «Проводника» перейдите к папке с DMP-файлом, выделите его и нажмите «Открыть».

По возвращении в окно «Advanced Options» нажмите «ОК».
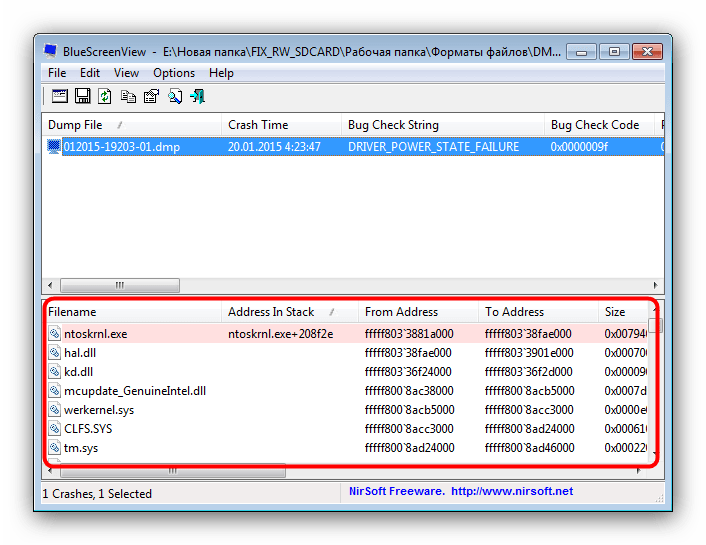
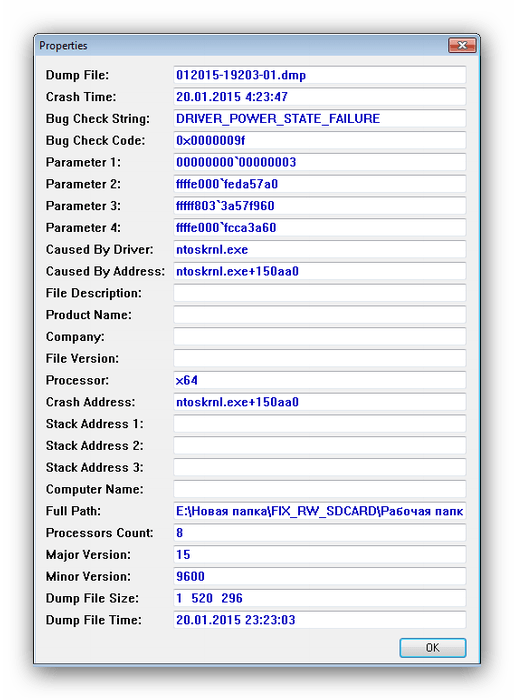
- Общие сведения о содержимом DMP можно просмотреть в нижней части основного окна BlueScreenView.

Для получения более подробной информации дважды кликните по загруженному в программу файлу.

Утилита BlueScreenView рассчитана на продвинутых пользователей, потому её интерфейс может показаться сложным для новичка. Кроме того, доступна она только на английском языке.
Способ 2: Microsoft Debugging Tools for Windows
В составе среды разработки Windows SDK распространяется инструмент для отладки, который называется Debugging Tools for Windows. Приложение, рассчитанное на разработчиков, способно открывать в том числе и DMP-файлы.
Загрузить Windows SDK с официального сайта
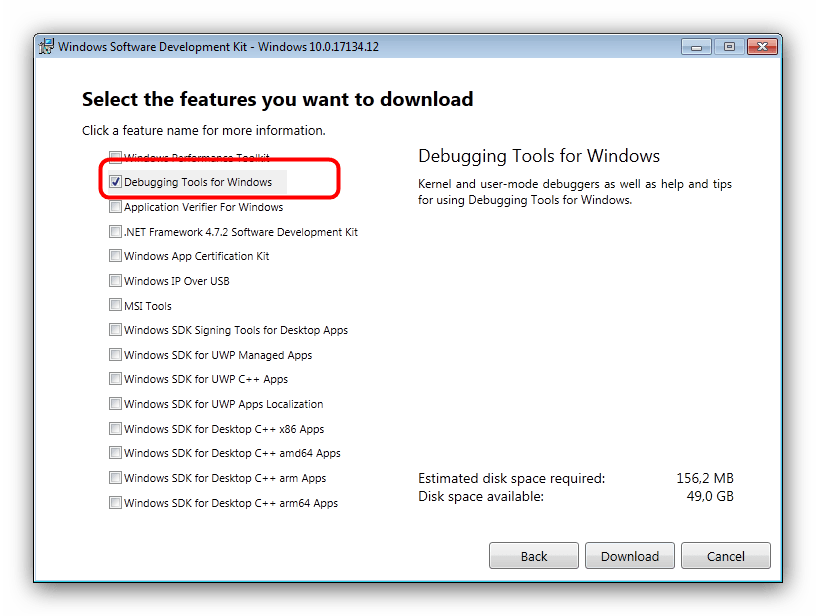
- Для экономии места можно выбрать только Debugging Tools for Windows, отметив соответствующий пункт в процессе загрузки компонентов.
- Запустить утилиту можно через «Пуск». Для этого откройте «Все программы», выберите «Windows Kits», а затем — «Debugging Tools for Windows».
Для запуска программы используйте ярлык «WinDbg».

Внимание! Для открытия DMP-файлов используйте только x64- или x86-версии дебаггера!
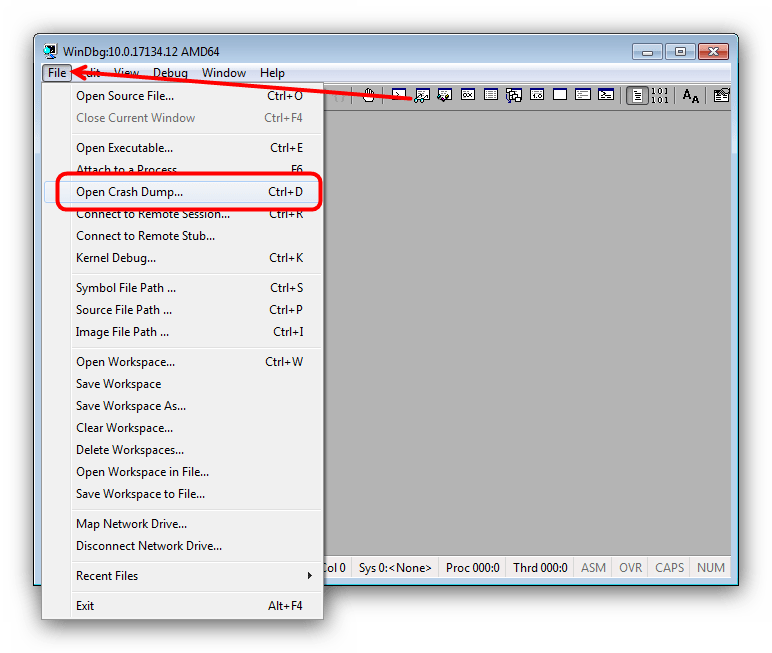
- Для открытия DMP используйте пункты «File» — «Open Crash Dump».

Затем через «Проводник» откройте местоположение нужного файла. Проделав это, выделите документ и откройте, нажатием на «Открыть».
- Загрузка и чтение содержимого DMP-файла в силу особенностей утилиты может занять некоторое время, так что запаситесь терпением. По окончании процесса документ будет открыт для просмотра в отдельном окошке.


Утилита Debugging Tools for Windows ещё более сложная, чем BlueScreenView, и тоже не имеет русской локализации, однако предоставляет более подробную и точную информацию.
Заключение
Как видим, основную сложность при открытии DMP-файлов составляют сами программы, рассчитанные больше на специалистов, чем на рядовых пользователей.
Наша группа в TelegramПолезные советы и помощь
If your system has crashed and experienced a Blue Screen of Death (BSoD), or a program or Windows feature suddenly crashes, Windows automatically generates a record of the conditions and circumstances under which the error occurred. This information is stored in dump files with the extension “.dmp.”
These dump files can help troubleshoot the root cause of the error so that it does not occur again.
This article contains everything you need to know about these dump files and how they can be opened in Windows, since there is no native method, so they can be analyzed to determine the cause of the error.
Table of Contents
Windows Crash Dump Files
Crash dump files, also known as “mini-dump files,” are system-generated binary files that contain various information about a crash that may have occurred on your computer. Like Event Viewer, these files can be used to determine the cause of the error, and then use that data to fix it. Dump files can contain the following data in them, which can be helpful for the matter:
The list below highlights the content which can be found inside a mini-dump file.
- The Stop message (error code), its parameters, and other data.
- List of loaded drivers.
- The processor context (PRCB) for the processor that stopped.
- Process information and kernel context (EPROCESS) for the process stopped.
- Process information and kernel context (ETHREAD) for the thread stopped.
- Kernel-mode call stack for the thread that stopped.
Dump files are created by copying the data off the system memory and onto the computer’s storage. It uses the Windows Page File and requires at least 2MB of free space. With this information, you can understand how different dump files are created.
Windows can write debugging information in three types of dump files.
Types of Dump Files
Complete Memory Dump
Complete Memory Dump files are the largest of the dump files. In this case, the complete contents of the memory are written onto the dump file.
When generated by the system, all old Complete Memory Dump files are replaced and overwritten.
Complete Memory Dump files are saved to C:\Windows\MEMORY.DMP file.
Kernel Memory Dump
Kernel Memory Dump files only contain data from kernel memory, which is why they are relatively smaller in size. Such files do not contain data from any unused, unallocated memory or the memory used by user-mode programs.
When generated by the system, all old Kernel Memory Dump files are replaced and overwritten.
Kernel Memory Dump files are also saved to C:\Windows\MEMORY.DMP file, the same as Complete Memory Dump files. However, only one of these is saved at a time and is overwritten when another crash occurs.
Small Memory Dump/Mini Memory Dump
The minidump file, which we will discuss in this post, is the smallest kind of dump file. This file contains the information described above that can assist in determining the cause of the crash.
Minidump files generated by the system are not overwritten. Instead, a new one is generated.
Minidump files can be found at C:\Windows\Minidump. If you do not find a directory named “Minidump,” it is likely because a dump file has not been created yet.
When a minidump file is created, Windows automatically includes the date it was created on. For example, in Windows 11, if a file is named “020322-18890-01.dmp,” “02” indicates the month, “03” indicates the date, and “22” indicates the year the file was created. “-01” at the end indicates it was the first dump file created that day.
The same is true for a minidump file created in Windows 10, which is automatically named something like “mini020322-01.dmp.”
Now let’s move on to opening and analyzing a dump file.
How to Read and Analyze DMP Files
As we mentioned, Windows does not allow you to open dump files directly. However, you can use other tools available online to open and analyze them. One of the most common tools to do so is through the Windows Debugging (WinDbg) tool, which can be downloaded through Microsoft Store. Continue reading the given guide below to use this tool to open and analyze memory dump files in Windows.
Using WinDbg
We have divided this section into 2 parts: Downloading and installing the WinDbg tool and then using it to analyze a dump file.
Download and Install WinDbg
- Open the WinDbg Preview page in the Microsoft Store and click Get.

- The browser will prompted you to open the Microsoft Store app, click Open Microsoft Store.
- From the Store app, click Get again.


The WinDbg tool will now begin to download and then install. We are now done with the installation phase. Let us now use the tool to open and analyze dump files.
Open and Analyze dmp files using WinDbg
- Open the WinDbg tool with administrative rights by searching for it through the search box, right-clicking it, and then clicking Run as administrator from the context menu.

- From the WinDbg tool, click File from the top menu.
- In the Start Debugging tab, click Open dump file.

- Now click Browse from the right pane within the tool and select the dump file that you want to analyze by navigating to
C:\Windows\Minidump. When selected, click Open.
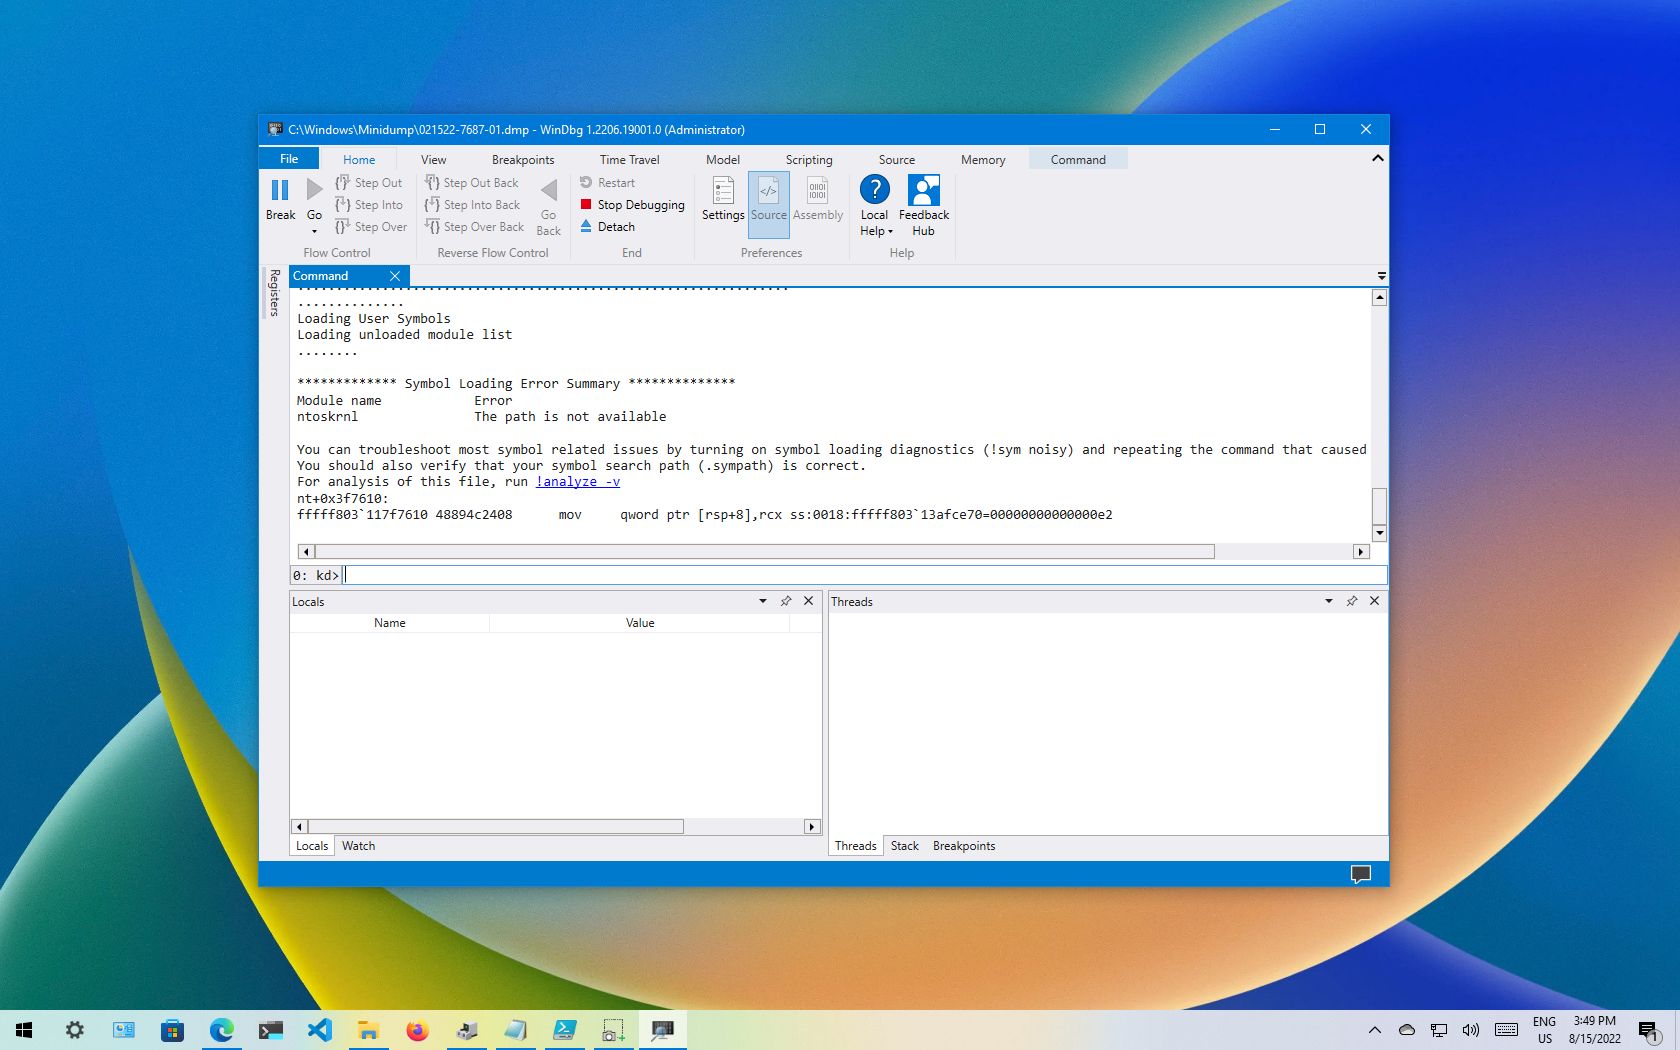
- The tool will now open the dump file, which can take a few minutes. When the dump file successfully opens, type in the following command in the text field in front of “0: kd>“:
!analyze -v
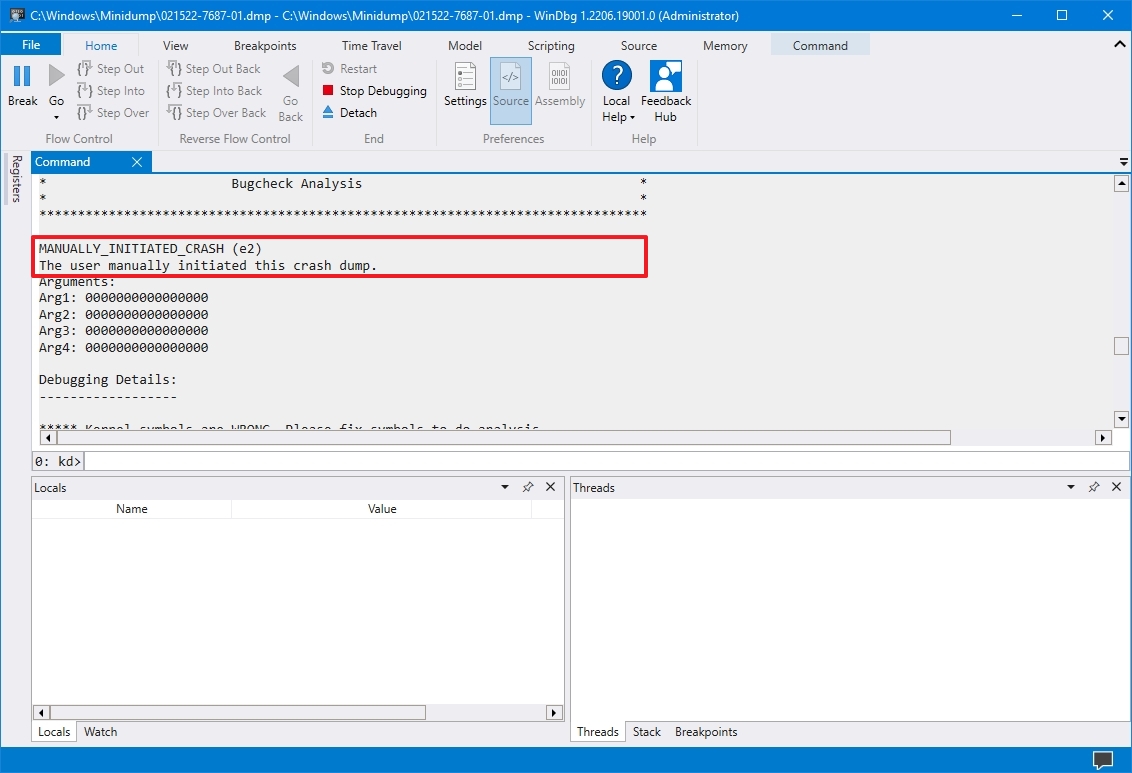
- WinDbg will now begin analyzing the dump file. This can take a few minutes to complete. Once completed, you should see the results in the top window.


In the example above, since we initiated a BSoD intentionally, it states “The user manually initiated this crash dump.” Otherwise, if it were an actual error, you would see different statements and information after performing the analysis of the dump file.
You can then use this information to troubleshoot the error that caused the crash.
Using WhoCrashed
Download WhoCrashed

WhoCrashed is available in both free and paid editions. However, the free edition is sufficient to open and analyze dump files. With this tool, you can obtain reports on the dump files with a single click. The tool will automatically scan your system files for any .dmp files and fetch the data within.
To do so, download WhoCrashed from the link given above, and run the .exe file to install in a few easy steps. Once installed, click Analyze from the ribbon menu at the top. The tool will then take a few seconds to scan any dump files and present the analysis. You can also view the .dmp files discovered from the Dump files tab.
Using BlueScreenView
Download BlueScreenView

BlueScreenView is a portable and small tool that can provide you with relevant information on minidump files. When you run this tool, it automatically picks up any .dmp files in the Minidump directory and displays the relevant information gathered from them. If there are multiple .dmp files, you can click on the one you want to analyze from the top field within the tool, and the information is presented in the bottom one.
Simply download the app from the link given above, extract the content and run the BlueScreenView application.
Final Thoughts
Dump files, regardless of their type, can be pretty useful when it comes to troubleshooting your operating system. However, the methods we have used above to analyze them may not be everyone’s cup of tea, as some of you may find them complex.
That said, there are more methods to analyze dump files using tools, but they involve using the Command prompt, not a Graphical User Interface (GUI). If you’d still like to learn more about it, you can read this detailed post by Microsoft on memory dump files.
Загрузить PDF
Загрузить PDF
Из этой статьи вы узнаете, как анализировать файлы дампа после сбоя Windows. В таких файлах, которые автоматически создаются после сбоя системы, содержится список программ, которые работали до сбоя; так можно выяснить, какие программы привели к сбою. Если вы ждете очередного сбоя или хотите протестировать программу, используйте бесплатную программу BlueScreenView, чтобы анализировать файлы дампа. Также можно воспользоваться бесплатным инструментом Windows 10 Drivers Kit (WDK), чтобы открыть файлы дампа.
-

Нажмите на логотип Windows в нижнем левом углу экрана.
-
Начнется поиск раздела «Просмотр расширенных параметров системы» Панели управления.
-
Этот значок в виде монитора с галочкой расположен в верхней части меню «Пуск». Откроется окно «Расширенные параметры системы».
-
Это вкладка в верхней части окна.
- Возможно, сначала нужно щелкнуть по значку в виде монитора, который находится в нижней части экрана, чтобы открыть окно «Расширенные параметры системы».
-
Эта кнопка находится в разделе «Загрузка и восстановление» в нижней части страницы. Откроется новое окно.
-
Вы найдете его посередине окна.
-
Эта опция находится в меню. В этом случае файлы дампа можно прочесть с помощью таких программ, как BlueScreenView.
-
Эта кнопка находится в нижней части окна. Вы вернетесь в окно «Расширенные параметры системы».
-
Изменения будут сохранены, а окно «Расширенные настройки системы» закрыто.
-
Перейдите на страницу https://www.nirsoft.net/utils/blue_screen_view.html в браузере. BlueScreenView — это программа, которая находит и анализирует файлы дампа, чтобы выяснить, какие программы работали до сбоя.
-
Прокрутите страницу вниз и нажмите «Download BlueScreenView with full install/uninstall support» (Скачать BlueScreenView с полной поддержкой); эта ссылка находится посередине страницы.
-
Дважды щелкните по файлу «bluescreenview_setup» в папке для загрузок.
-
Для этого:
- нажмите «Да», когда будет предложено;
- нажмите «Next» (Далее);
- нажмите «Next» (Далее);
- нажмите «Install» (Установить);
- дождитесь, когда BlueScreenView будет установлена.
-
Установите флажок у «Run NirSoft BlueScreenView» (Запустить NirSoft BlueScreenView), а затем нажмите «Finish» (Завершить) в нижней части окна. BlueScreenView откроется.
-
В BlueScreenView есть верхняя и нижняя панели; файл дампа отобразится на верхней панели, а на нижней появится список программ, которые работали до сбоя.
- Чтобы выбрать файл дампа, щелкните по нему на верхней панели.
- Скорее всего, как минимум одна программа, которая есть в файле дампа, ответственна за сбой.
Реклама


-
-
Прокрутите страницу вниз и нажмите «Download WDK for Windows 10, version 1803» (Скачать WDK для Windows 10, версия 1803); эта ссылка находится в разделе «Install WDK for Windows 10» (Установить WDK для Windows 10) в верхней части страницы.
-
Дважды щелкните по файлу «wdksetup» в папке для загрузок.
-
Для этого:
- нажмите «Next» (Далее) на первых 4 страницах;
- нажмите «Accept» (Принять);
- нажмите «Yes» (Да), когда будет предложено;
- дождитесь, когда WDK будет установлен.
-
Нажмите на логотип Windows в нижнем левом углу экрана.
-
Начнется поиск командной строки.
-
Это значок в виде черного квадрата в верхней части меню «Пуск». Раскроется меню.
-
Эта опция находится в меню.
- Вы не сможете выполнить этот шаг, если у вас нет учетной записи администратора.
-
Запустится командная строка (с правами администратора).
-
Введите следующий адрес, а затем нажмите ↵ Enter:
cd C:\Program Files (x86)\Windows Kits\10\Debuggers\x86
-
Введите
windbg.exe -IA, а затем нажмите ↵ Enter. -
Теперь WDK будет автоматически открывать файлы дампа.
-
Откройте меню «Пуск»

, введите windbg и нажмите «WinDbg (X86)» в результатах поиска. Откроется Отладчик Windows.
-
Путь к символу указывает отладчику Windows, какую информацию следует отобразить:[1]
- нажмите «File» (Файл) в верхнем левом углу;
- нажмите «Symbol File Path» (Путь к символу);
- введите
SRV*C:\SymCache*http://msdl.microsoft.com/download/symbols - нажмите «OK».
-
Для этого перейдите в корневой каталог системы:
- откройте меню «Пуск»;
- введите выполнить и нажмите ↵ Enter;
- введите %SystemRoot%;
- нажмите «OK»;
- перейдите на вкладку «Вид»;
- установите флажок у «Скрытые элементы»;
- прокрутите вниз и дважды щелкните по файлу «MEMORY.DMP».
-
Отобразится список программ, которые работали до сбоя — этот список поможет выяснить, какая программа(ы) привела к сбою.
Реклама


Советы
- BlueScreenView идеально подходит для тестирования различных программ (например, запустите программу и проверьте, произойдет ли сбой), так как она быстро устанавливается и запускается.
Реклама
Предупреждения
- Компьютерные сбои, особенно «синие экраны смерти» (BSOD), могут случиться по разным причинам — от неисправного приложения до сломанного процессора. Таким образом, даже если вы просмотрите содержимое файла дампа, не факт, что вы найдете причину сбоя.
Реклама
Об этой статье
Эту страницу просматривали 23 079 раз.
Была ли эта статья полезной?
Opening a DMP file on Windows 11 allows you to gain insights into system crashes or errors by analyzing the dump file created during such events. This can be essential for troubleshooting and understanding what might be causing issues with your computer. To open a DMP file, you’ll use a program called WinDbg, part of the Windows Software Development Kit (SDK). Here’s a simplified guide to help you navigate this process.
Opening a DMP file on Windows 11 involves a few straightforward steps. Once you set up your tools, you’ll have the power to explore the depths of computer errors and troubleshoot like a pro. Let’s dive into the steps!
Step 1: Download the Windows Software Development Kit (SDK)
You’ll need to download and install the Windows SDK to access WinDbg.
The Windows SDK contains various tools and libraries, including WinDbg, which you need to open DMP files. Head over to the Microsoft website, search for the Windows SDK, and start the download. Follow the on-screen instructions to install it on your system.
Step 2: Launch WinDbg
Next, open the newly installed WinDbg from your Start menu.
After installing the Windows SDK, you’ll find WinDbg in your list of programs. Launch it by clicking on it, and remember, this tool is your gateway to understanding the complexities behind DMP files.
Step 3: Set the Symbol Path
Navigate to File > Symbol File Path and enter the symbol path link.
Symbols are critical for debugging because they provide a human-readable format for dump files. Set your symbol path to srv*c:symbols*http://msdl.microsoft.com/download/symbols to ensure WinDbg can properly read the DMP file.
Step 4: Open the DMP File
Use the File menu to locate and open your DMP file.
With the symbol path set, you’re ready to open your DMP file. Go to File > Open Crash Dump and locate the file you want to analyze. This step will load the dump file into WinDbg for examination.
Step 5: Analyze the DMP File
Type !analyze -v in the command line to start the analysis.
Once your DMP file is loaded, you can start analyzing it by typing the command !analyze -v. This command will provide detailed information about what might have caused the crash or error, giving you a clearer direction on how to address the issue.
Upon completing these steps, you’ll have a detailed analysis of the crash or error that occurred. This can help you identify specific problems with your system, allowing you to take corrective measures or consult with a technician for further assistance.
Tips for Opening DMP File on Windows 11
- Keep your Windows SDK updated to ensure compatibility with the latest DMP files and debugging tools.
- Familiarize yourself with the common commands in WinDbg to enhance your analysis skills.
- Ensure your system has enough available disk space for symbol files, as they can be quite large.
- Regularly check the Microsoft support site for updates or additional resources on using WinDbg.
- Practice with sample DMP files to build your confidence before tackling more complex issues.
Frequently Asked Questions
What is a DMP file?
A DMP file is a dump file created by Windows when a system crashes or encounters errors, containing information that helps in diagnosing the issue.
Why do I need WinDbg to open a DMP file?
WinDbg is a specialized tool that interprets DMP files, presenting the data in a format that is understandable and useful for troubleshooting.
Can I delete DMP files after opening them?
Yes, once you’ve analyzed the DMP file and no longer need it, you can delete it to free up space on your hard drive.
What causes DMP files to be created?
DMP files are typically created when your computer crashes or encounters a critical error, providing a snapshot of what was happening at that moment.
Is there an alternative to WinDbg for opening DMP files?
While WinDbg is the preferred tool, other third-party applications can also open DMP files, though they might not offer the same depth of analysis.
Summary
- Download Windows SDK.
- Launch WinDbg.
- Set Symbol Path.
- Open DMP File.
- Analyze DMP File.
Conclusion
Opening a DMP file on Windows 11 might seem daunting at first, but once you understand the steps, it becomes a valuable skill in your troubleshooting toolkit. DMP files serve as windows into the soul of your computer, guiding you through the intricacies of system errors and crashes. With the help of WinDbg, you can demystify these files, gaining insights that empower you to make informed decisions about your system’s health.
If you’re new to this, take your time with each step, and don’t hesitate to explore additional resources to enhance your understanding. As you become more comfortable, consider sharing your newfound knowledge with others who might be facing similar challenges. The world of tech is ever-evolving, and staying informed is the best way to keep pace. Embrace the journey of learning how to open DMP files on Windows 11, and you’ll be better equipped to maintain a stable and efficient computing environment.
Matthew Burleigh has been writing tech tutorials since 2008. His writing has appeared on dozens of different websites and been read over 50 million times.
After receiving his Bachelor’s and Master’s degrees in Computer Science he spent several years working in IT management for small businesses. However, he now works full time writing content online and creating websites.
His main writing topics include iPhones, Microsoft Office, Google Apps, Android, and Photoshop, but he has also written about many other tech topics as well.
Read his full bio here.
On Windows 10, when there is a crash, the system creates a «dump» file containing the memory information at the time of the error, which can help determine the reason for the problem.
The «.dmp» file includes the stop error message, a list of the drivers loaded at the time of the problem, kernel, processor, and process details, as well as other information depending on the type of dump file you have.
Although Windows 10 automatically creates dump files, the only problem is that you won’t find any built-in tools to open this type of file, and this is when the Microsoft Windows Debugging (WinDbg) tool can help. WinDbg is an advanced tool designed for debugging kernel-mode and user-mode code, reviewing processor registries, and analyzing crash dumps.
This guide will walk you through the steps to open a dump file to determine what caused the crash to resolve the problem on your computer.
How to open dump file with WinDbg on Windows 10
On Windows 10, you may find multiple ways to open and review a dump error file, but the easiest way is to use the WinDbg tool available through the Microsoft Store.
Install WinDbg
To install the WinDbg tool on Windows 10, use these steps:
All the latest news, reviews, and guides for Windows and Xbox diehards.
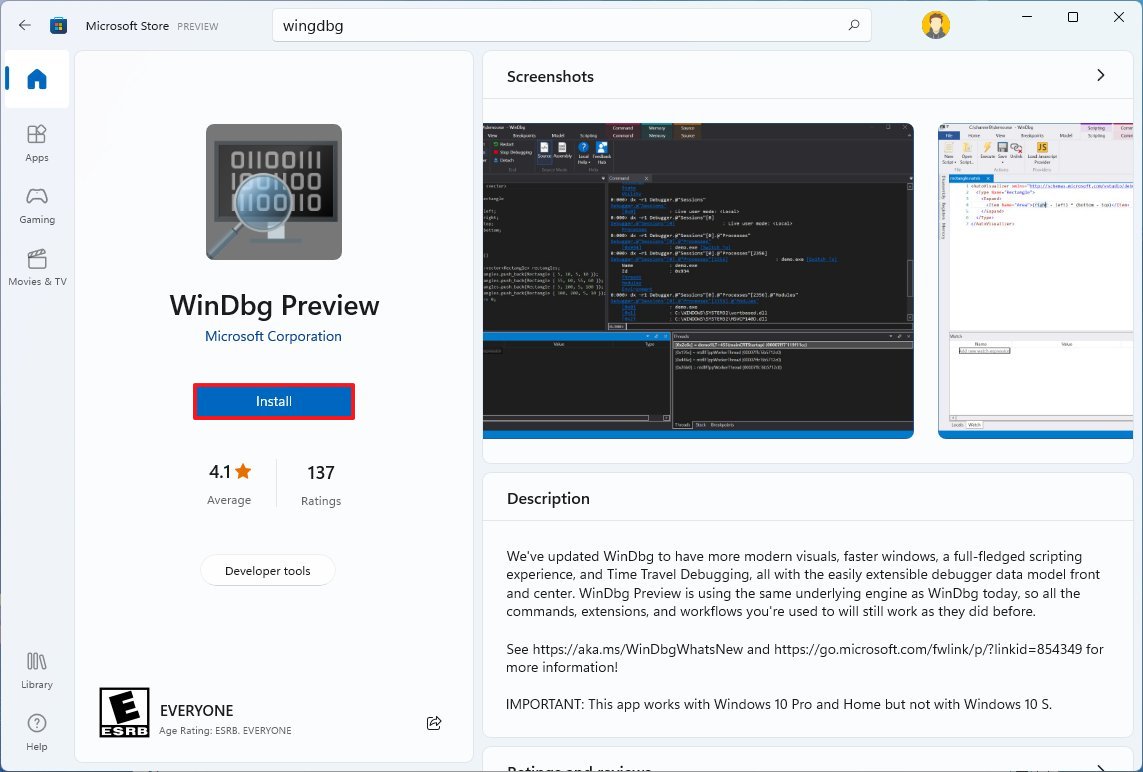
- Open the WinDbg download page.
- Click the Install button.
- Click the Open button.
- Click the Install button.
Once you complete the steps, the application will install, and it will be available through the Start menu.
Analyze dump file
To open and analyze a dump file created by a crash on Windows 10, use these steps:
- Open Start.
- Search for WinDbg, right-click the top result, and select the Run as administrator option.
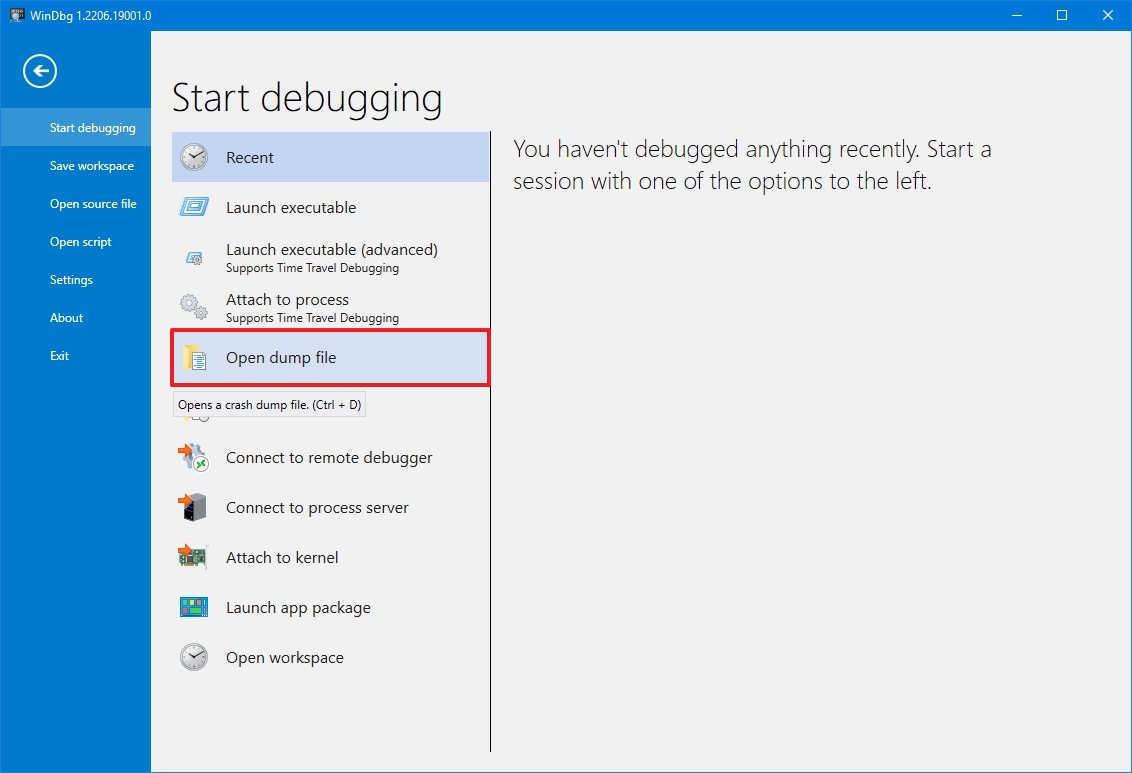
- Click the File menu.
- Click on Start debugging.
- Select the Open sump file option.
- Select the dump file from the folder location — for example, %SystemRoot%\Minidump.
- Click the Open button.
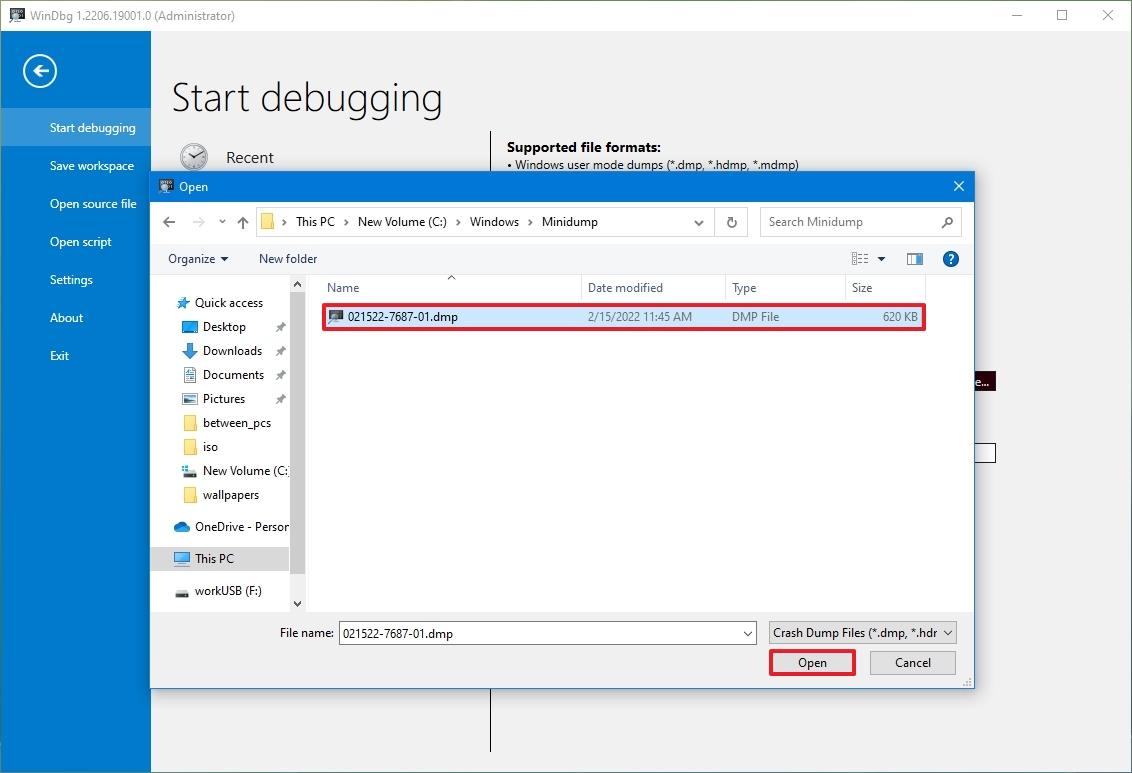
- Click the Open button again.
- Check the progress bar until it loads the dump file (this may take a while).
- Type the following command in the run command and press Enter: !analyze -v
- Quick tip: You can also click the !analyze -v link if available from the main area if available after loading the dump file.
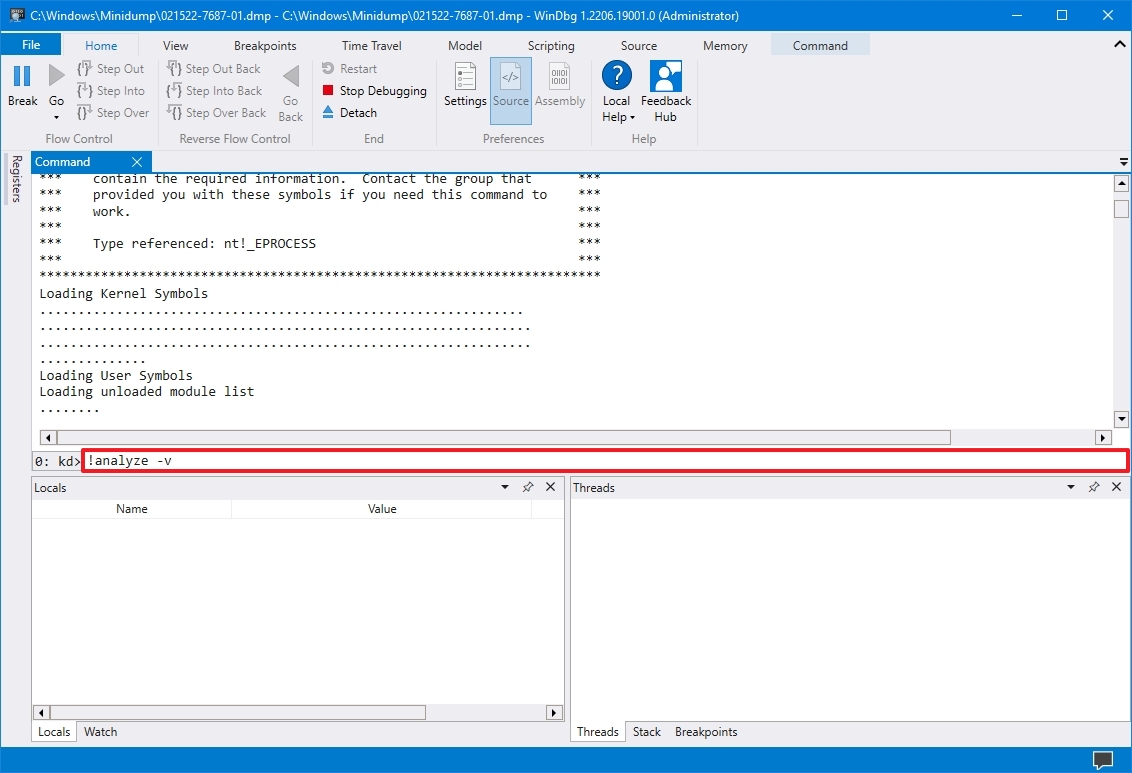
- Check the progress bar until the analysis is complete (this may take a long time depending on the data size).
After you complete the steps, the application will return the dump file analyses, which you can then review to determine the reason for the problem to help you resolve the issue.
The information will be different depending on the problem. For example, this result points out that this was a manually initiated crash with an «e2» error code, which is correct since, for this guide, we use these instructions to force a dump file. The WinDbg even makes an excellent job describing the crash in a language anyone can understand («The user manually initiated this crash dump»).
As you continue reviewing the dump file, you will also find more information, such as «FAILURE_BUCKET_ID» and «MODULE_NAME,» which could indicate what is causing the problem.
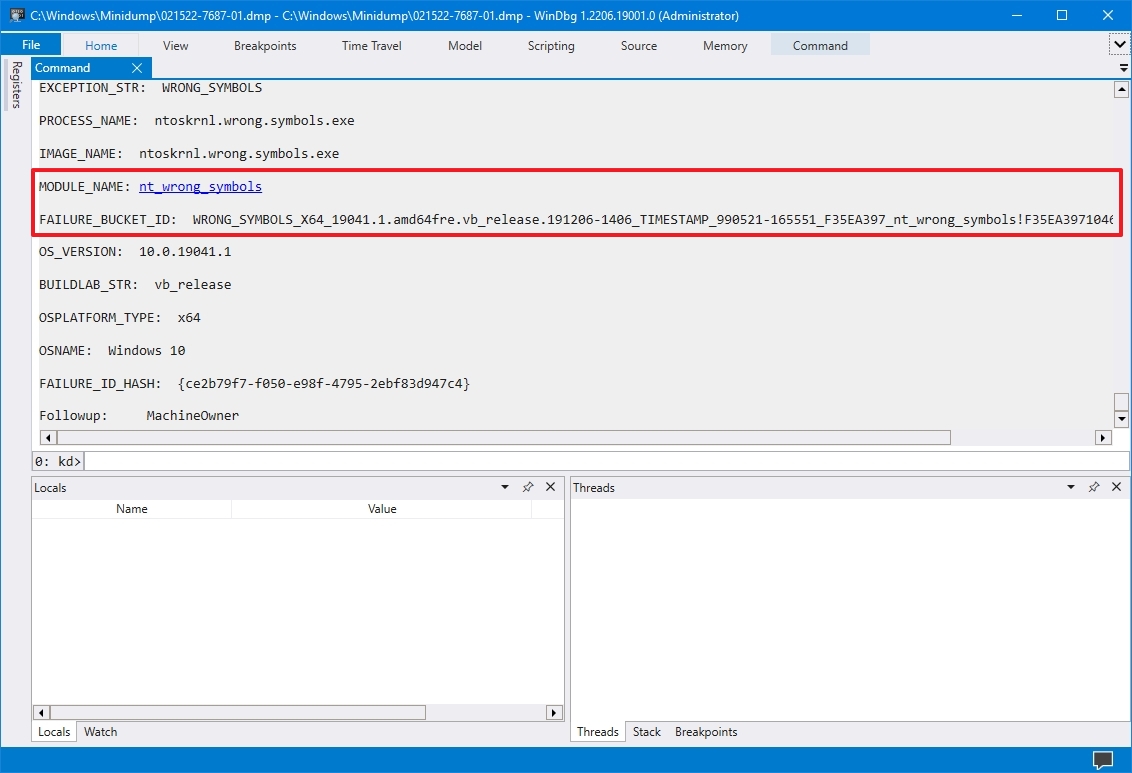
The information can be overwhelming since it is not meant for regular users. If your computer keeps crashing, you can use this tool to get an idea of the problem. If you cannot figure it out, you can use the hints in the report to search online for more information.
More resources
For more helpful articles, coverage, and answers to common questions about Windows 10 and Windows 11, visit the following resources:
- Windows 11 on Windows Central — All you need to know
- Windows 10 on Windows Central — All you need to know
Mauro Huculak has been a Windows How-To Expert contributor for WindowsCentral.com for nearly a decade and has over 15 years of experience writing comprehensive guides. He also has an IT background and has achieved different professional certifications from Microsoft, Cisco, VMware, and CompTIA. He has been recognized as a Microsoft MVP for many years.