
При системных сбоях Windows 11 по умолчанию создаёт файлы дампов памяти, которые в дальнейшем могут быть использованы для того, чтобы разобраться с причинами синего экрана и устранить их. Однако, некоторые пользователи могут столкнуться с тем, что дампы не сохраняются.
В этой инструкции подробно о том, как включить создание дампов памяти в Windows 11 в различных ситуациях и дополнительная информация, которая может быть полезной.
Настройка записи дампа памяти в свойствах системы
Прежде чем приступить к описанию необходимых действий, базовая информация о дампах памяти в Windows 11 и предыдущих версиях системы:
- Для создания дампов памяти требуется, чтобы файл подкачки не был отключён, ещё лучше, если его размер будет выбираться автоматически системой. Подробно про настройку файла подкачки.
- С параметрами по умолчанию при синем экране полный дамп памяти сохраняется в файл
C:\Windows\MEMORY.DMP
который заменяется при каждом сбое, одновременно сохраняются мини-дампы (малые дампы памяти) в папке
C:\Windows\Minidump
они не удаляются при новых сбоях (по умолчанию сохраняются 5 последних) и обычно достаточны для анализа причин ошибок со стороны пользователя.
- Различные программы для очистки и оптимизации Windows или продления срока службы SSD могут удалять файлы дампов или отключать их создание.
Для анализа дампов памяти можно использовать специальные утилиты, о которых в отдельной инструкции.
Базовый способ включить создание дампов памяти при сбоях — использовать параметры системы, шаги будут следующими:
- Нажмите клавиши Win+R на клавиатуре, либо нажмите правой кнопкой мыши по кнопке «Пуск» и выберите пункт «Выполнить», введите команду sysdm.cpl и нажмите Enter.
- Перейдите на вкладку «Дополнительно» и нажмите по кнопке «Параметры» в разделе «Загрузка и восстановление».

- В следующем окне, в разделе «Отказ системы» вы увидите доступные параметры создания дампов памяти, на скриншоте ниже — параметры по умолчанию при включенном автоматическом сохранении дампов: обычно достаточно установить «Автоматический дамп памяти», указать место сохранения дампа памяти, по умолчанию —
%SystemRoot%\MEMORY.DMP
и применить настройки.


В поле выбора типа записи отладочной информации есть несколько вариантов выбора:
- Автоматический дамп памяти — сохраняет снимок памяти ядра, отладочную информацию и снимок памяти, выделенной для устройств, драйверов и другого ПО, работающего на уровне ядра. Также сохраняются мини-дампы памяти в C:\Windows\Minidump
- Малый дамп памяти — выполняется сохранение только мини-дампов: файлов, содержащих базовую информацию о сбое и вызвавших синий экран модулях, загруженных драйверах и процессах. Для обычного пользователя, желающего разобраться в причинах ошибок, обычно бывает достаточным.
- Дамп памяти ядра — содержит дамп всей оперативной памяти, используемой ядром Windows на момент сбоя.
- Полный дамп памяти — сохраняет полный снимок оперативной памяти в файле MEMORY.DMP, размер дампа будет равен объёму занятой оперативной памяти на момент сбоя. В большинстве случаев не требуется.
- Активный дамп памяти — то же самое, что в предыдущем случае, но с фильтрацией страниц памяти, которые с большой вероятностью не относятся к сбою, потому занимает меньше места на диске.
Если несмотря на то, что создание дампов памяти включено, они не создаются, проверьте события в Просмотре событий, возможно там регистрируется ошибка их создание. Об исправлении — в отдельной инструкции Не удалось создать файл дампа из-за ошибки при создании дампа — варианты решения.
Редактор реестра
Способ включения создания дампов памяти в редакторе реестра может пригодиться в случае, если вы сталкиваетесь с синим экраном раньше, чем появляется возможность выполнить настройки в самой ОС.
В этом случае вы можете использовать редактор реестра в среде восстановления (regedit в командной строке) или с WinPE:
- Запустить редактор реестра, выбрать раздел
HKEY_LOCAL_MACHINE
- Использовать меню «Файл» — «Загрузить куст» и загрузить файл SYSTEM из
C:\Windows\System32\config
после чего задать удобное имя раздела, под которым загруженный куст будет отображаться внутри
HKEY_LOCAL_MACHINE
во время редактирования.
- Внутри созданного вами раздела перейти к нужному подразделу и выполнить необходимые изменения.
Основной параметр для определения типов создаваемых дампов памяти — это DWORD с именем CrashDumpEnabled, который при работающей ОС можно найти в разделе
HKEY_LOCAL_MACHINE\SYSTEM\CurrentControlSet\Control\CrashControl

в случае, если выполнялась загрузка куста удаленного реестра, как было описано выше, путь будет следующим:
HKEY_LOCAL_MACHINE\заданное_имя\ControlSet001\Control\CrashControl

Параметр CrashDumpEnabled может принимать значения:
- 0 — дамп памяти отключен
- 1 — полный дамп памяти
- 2 — дамп памяти ядра
- 3 — создание мини-дампов
- 7 — автоматический дамп памяти
Как было отмечено выше, следует также учитывать необходимость включенного файла подкачки, настройки которого хранятся в разделе
HKEY_LOCAL_MACHINE\SYSTEM\CurrentControlSet\Control\Session Manager\Memory Management
О том, как именно задать необходимые параметры — в отдельной инструкции по настройке файла подкачки в редакторе реестра.
Дополнительно, рекомендую не отключать сохранение события в системный журнал (параметры в реестре EnableLogFile и LogEvent, значение — 1), так как эта информация также может пригодиться для диагностики причин возникающих сбоев.
Все способы:
- Что это такое
- Вариант 1: Удаление мусорных файлов
- Вариант 2: Отключение дампа памяти
- Вариант 3: Исправление ошибки дампа памяти
- Способ 1: Восстановление системных файлов
- Способ 2: Проверка диска
- Способ 3: Автоматическое восстановление
- Анализ дампа памяти
- Вопросы и ответы: 0
Что это такое
Для начала следует разобраться, что такое дамп памяти и в каких ситуациях пользователи сталкиваются с ним. В зависимости от этого и применяются различные способы устранения неполадки. Дамп памяти – это файл, который автоматически создается при возникновении критических ошибок в работе операционной системы.
Если вкратце, наверняка каждый юзер Windows получал «синий экран смерти» (BSOD), который по своей сути является результатом различных сбоев. Он появляется на любой стадии использования ОС, а сама система при возникновении такого экрана автоматически создает один или несколько файлов. Они содержат в себе отладочную информацию о компьютере, включая данные, которые при критической ошибке, повлекшей BSOD, находились в ОЗУ. Такие сведения позволяют понять причину проблемы, которая вызывает «синий экран смерти». То есть система генерирует дамп, а аварийным он называется, потому что формируется при возникновении аварий в работе ОС.
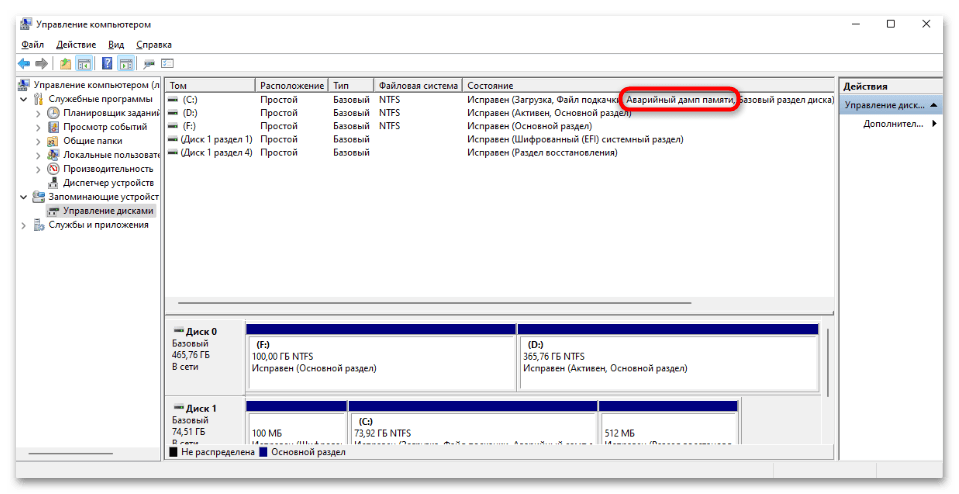
Теперь стоит понять, как нужно действовать при появлении дампа памяти. Например, если рядом с названием диска в утилите «Управление дисками» появляется надпись «Аварийный дамп памяти», тогда это не является ошибкой. Тут указана информация о том, что файлы со сведениями о системной проблеме попросту хранятся на этом томе. Соответственно, исправлений никаких не требуется, но можно убрать данную надпись, о чем мы написали в Вариантах 1 и 2.
В случае если BSOD появляется периодически, тогда может потребоваться решение проблемы на системном уровне, а дамп памяти лишь поможет выяснить, что случилось. В Варианте 3 мы рассмотрели наиболее распространенные пути решения (даже когда Windows 10 не запускается), а также привели несколько специализированных программных средств, с помощью которых можно проанализировать дамп памяти.
Вариант 1: Удаление мусорных файлов
Как уже говорилось, при появлении сообщений о дампе памяти, касающихся локального диска, беспокоиться не стоит – это не проблема накопителя, а лишь информация о том, что файлы были созданы именно на этом разделе. Но можно убрать дамп памяти, очистив данный диск.
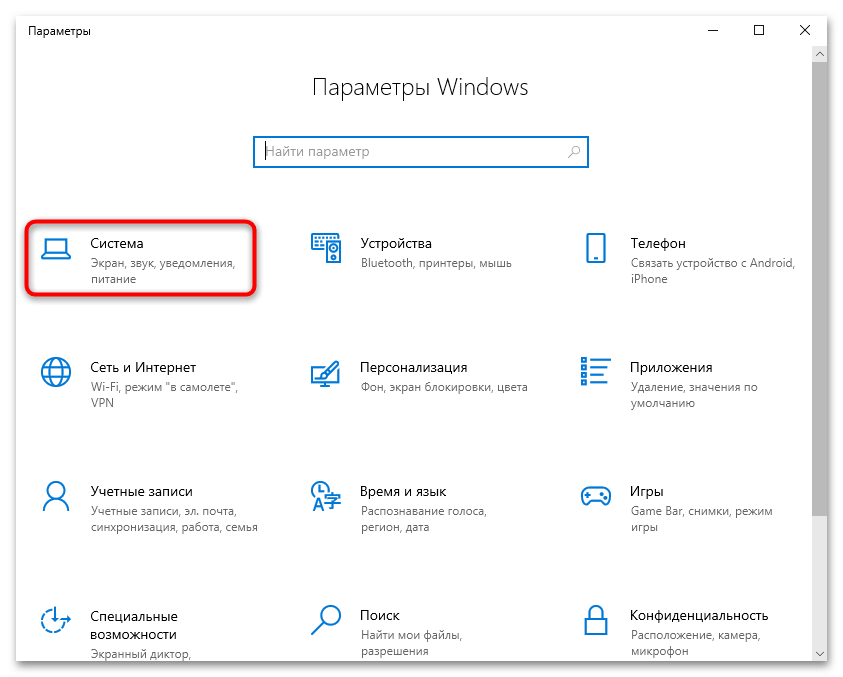
- Нажмите на кнопку «Пуск» и выберите запуск штатных «Параметров».
- Перейдите в раздел «Система».
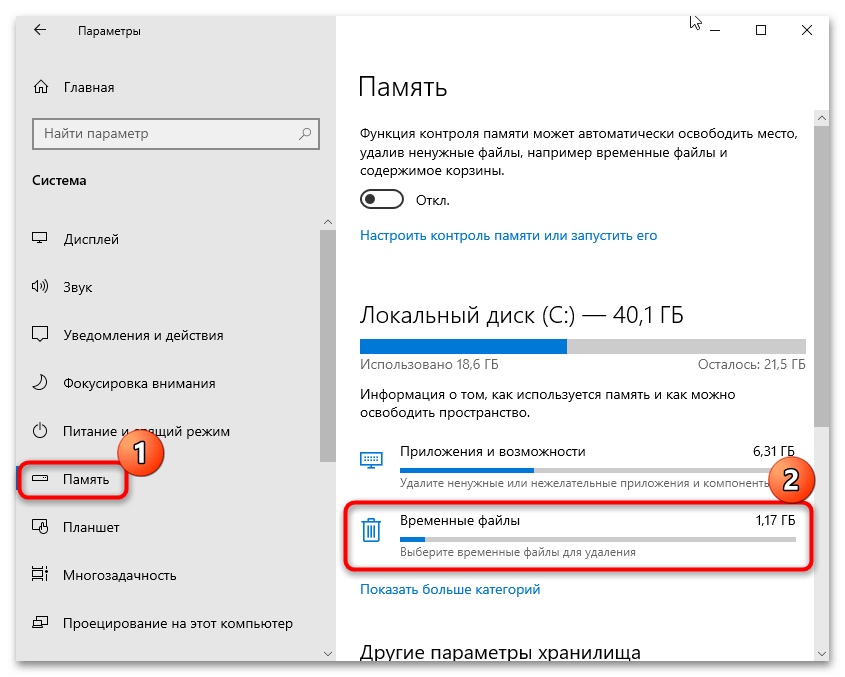
- Через левую панель переключитесь на вкладку «Память», затем в центральной части окна найдите локальный диск, у которого появилось сообщение об аварийном дампе памяти, и нажмите по «Временные файлы».
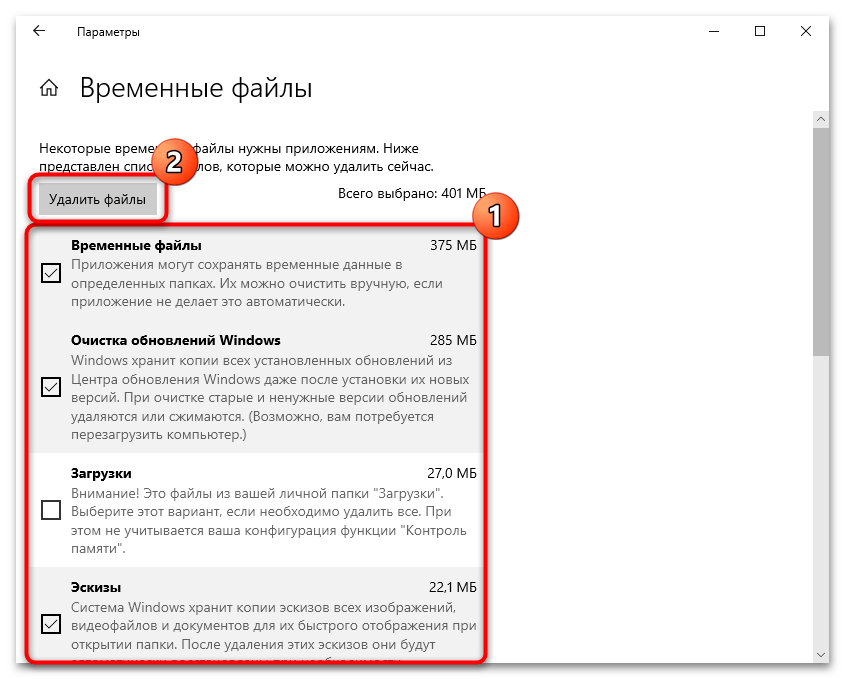
- После сканирования системы отобразятся различные временные файлы. Снимите галочки у всех пунктов, кроме «Файлы дампа памяти для системных ошибок» (впрочем, по желанию можно очистить и другие категории), затем нажмите на кнопку «Удалить файлы», расположенную вверху.
Удалить дампы памяти с локального диска можно и другим способом – вручную через файловую систему. Достаточно запустить «Проводник» и перейти к корневой директории диска. Если это системный раздел, то откройте папку «Windows», где должен располагаться файл под названием «MEMORY.DMP» (это основной дамп памяти), а в каталоге «Minidump» можно найти малые дампы (их размер, как правило, составляет около 1 МБ). Удалите эти данные, но для процедуры потребуются права администратора.
Читайте также: Получение прав Администратора на компьютере с Windows 10
Вариант 2: Отключение дампа памяти
В Windows 10 можно отключить автоматическое создание файла с данными об ошибке – то есть дампа памяти. Конечно, это позволит избежать появления различных предупреждающих надписей и иногда BSOD, но при этом системная ошибка, вызывающая это, исправлена не будет, и, возможно, узнать потом причину ее появления без дампа памяти окажется довольно проблематично.
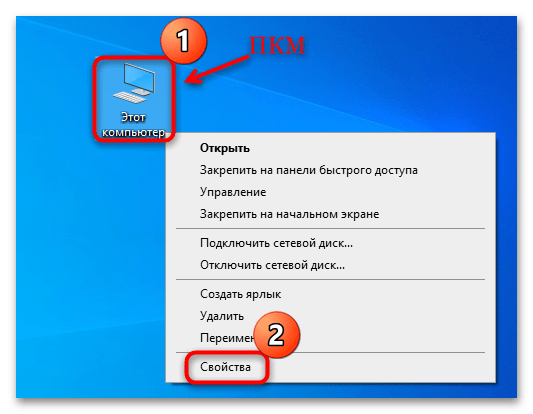
- Кликните правой кнопкой мыши по иконке «Этот компьютер» на рабочем столе и из контекстного меню выберите пункт «Свойства».
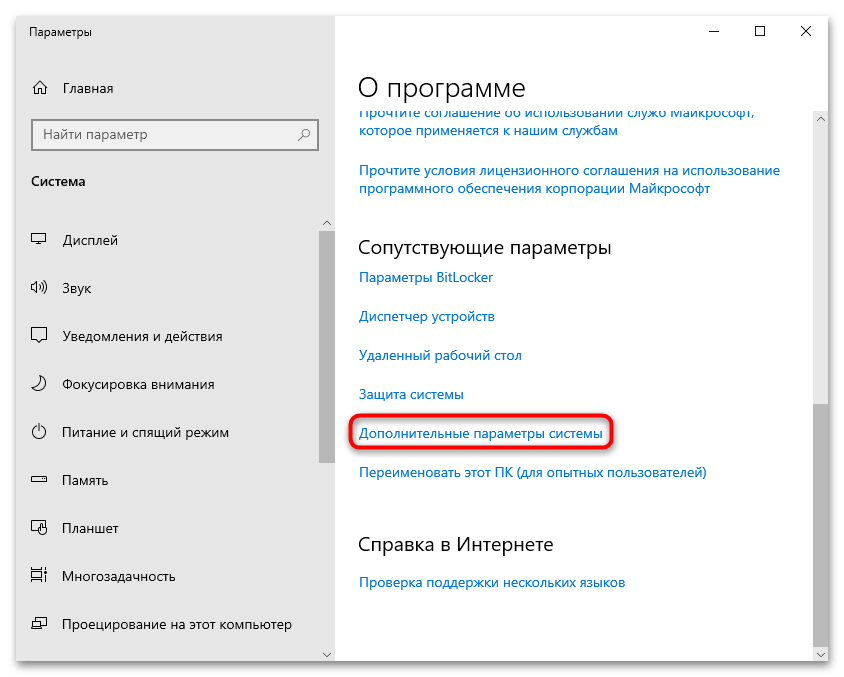
- В открывшемся окне штатных «Параметров» кликните по строке «Дополнительные параметры системы» в блоке «Сопутствующие параметры».
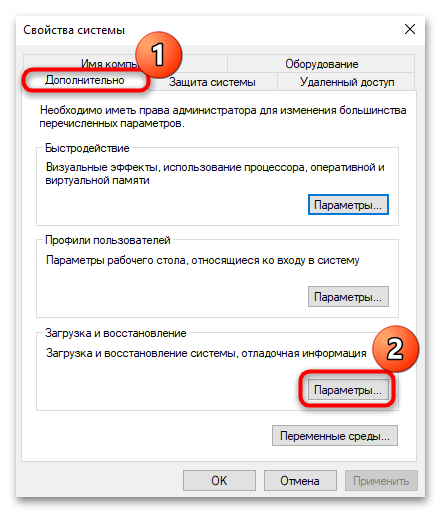
- На вкладке «Дополнительно» в разделе «Загрузка и восстановление» щелкните по кнопке «Параметры».
- Из выпадающего меню «Запись отладочной информации» выберите пункт «Нет», чтобы отключить аварийный дамп памяти. Нажмите на «ОК» для сохранения настроек.
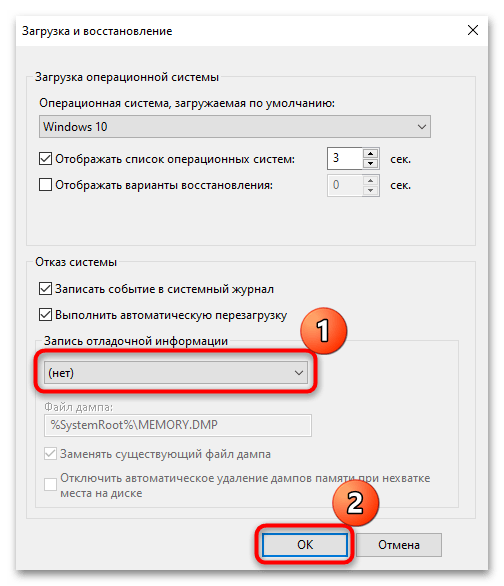
Кстати, изменить путь сохранения для дампа памяти можно здесь же: в текстовом поле «Файл дампа» пропишите нужный адрес.
Вариант 3: Исправление ошибки дампа памяти
Аварийный дамп памяти может быть создан по различным причинам, в частности из-за системных ошибок любого характера. Мы рассмотрим несколько универсальных способов, позволяющих решить многие распространенные неполадки в работе ОС.
Способ 1: Восстановление системных файлов
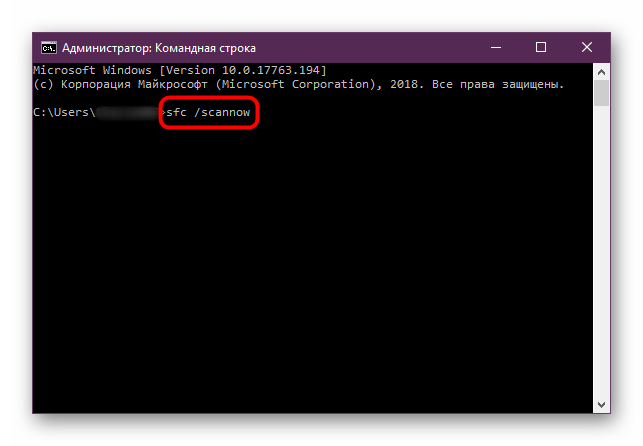
В первую очередь стоит проверить целостность системных файлов, поскольку синий экран и, соответственно, запись дампа памяти часто возникают именно по этой причине. Системные компоненты повреждаются вследствие разных неполадок в работе ОС, а также в результате вирусных атак, но в «десятке» предусматривается специальное средство для сканирования и восстановления поврежденных файлов Windows. О применении такой утилиты мы писали в отдельном материале.
Подробнее: Как проверить целостность системных файлов в Windows 10
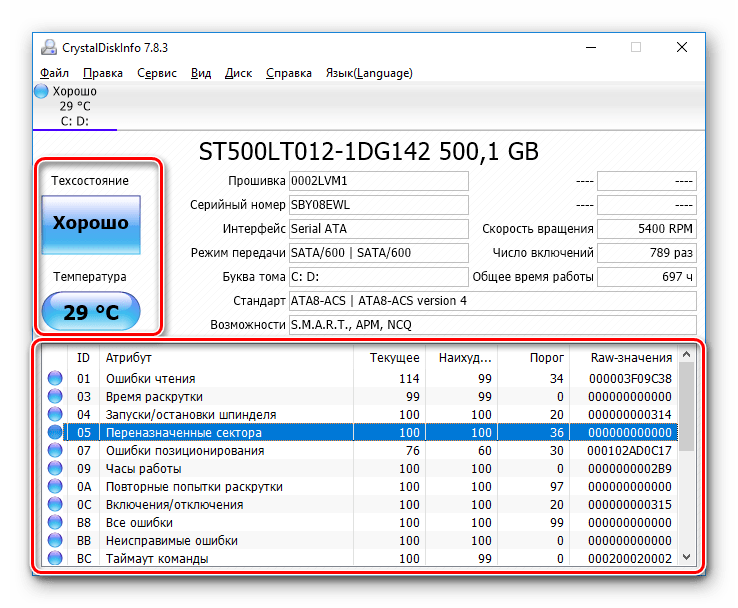
Способ 2: Проверка диска
Также не лишним будет проверить накопитель на наличие ошибок, которые могут стать причиной создания дампа памяти. Для этого предназначен специальный инструмент, который встроен в операционную систему. Можно еще воспользоваться средствами от сторонних разработчиков. Переходите по ссылке ниже, чтобы узнать, как правильно выполнить диагностику диска на компьютере с Windows 10.
Подробнее:
Выполнение диагностики жесткого диска в Windows 10
Проверка работоспособности SSD
Способ 3: Автоматическое восстановление
Если после появления BSOD система не стартует, скорее всего, придется запустить автоматическое восстановление. В Windows 10 реализована специальная среда (WinRE), с помощью которой выполняются различные манипуляции по восстановлению работы ОС, диагностики и использование системных средств, например «Командной строки». Вероятно, важные файлы оказались повреждены, отчего и не получается полноценно пользоваться ОС.
Подробнее: Запускаем автоматическое восстановление в Windows 10
Анализ дампа памяти
Различные ошибки в работе операционной системы требуют правильного подбора методов решения. При создании аварийного дампа памяти важно корректно его проанализировать и найти нужный способ исправления неполадки. Для анализа файла дампа существуют специализированные программы, как правило, устанавливаемые отдельно. Одним из таких инструментов является фирменная утилита от компании Microsoft – WinDbg. С ее помощью можно посмотреть информацию, которая содержится в файле с расширением DMP, созданного после появления BSOD.
Скачать WinDbg с официального сайта
- Перейдите по ссылке выше и скачайте инсталляционный файл программы, нажав на кнопку «Скачивание установщика».
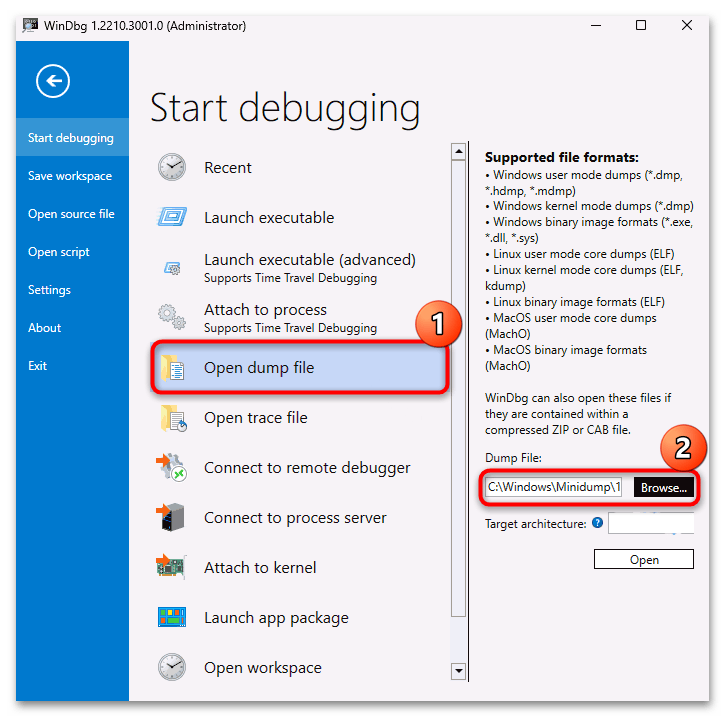
- Далее запустите сохраненный файл и выполните установку на локальный диск. Откройте установленную программу от имени администратора, кликнув правой кнопкой мыши по ярлыку и выбрав нужный тип запуска. В главном окне кликните по строке «Open dump file» и укажите к нему путь (как мы уже упоминали в Варианте 1, он хранится на системном диске в папке «Windows»).
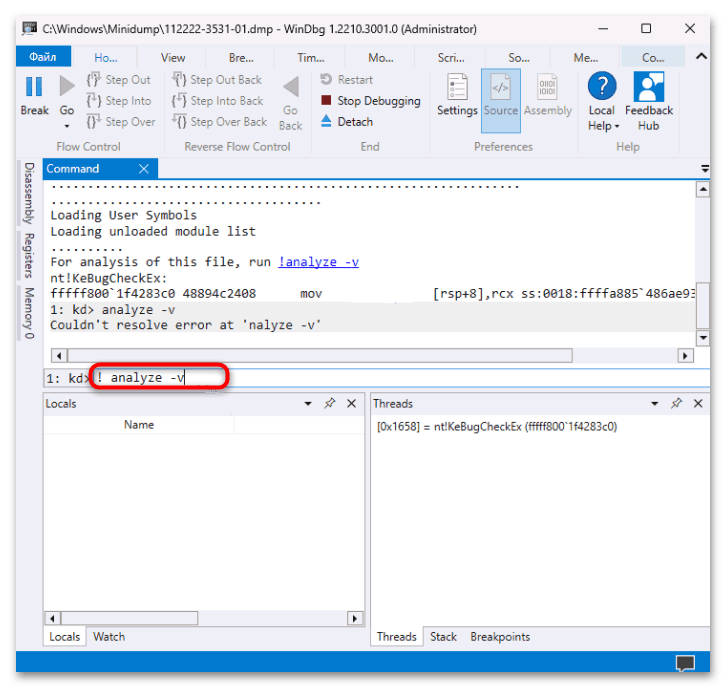
- В текстовом поле панели «Command» введите команду
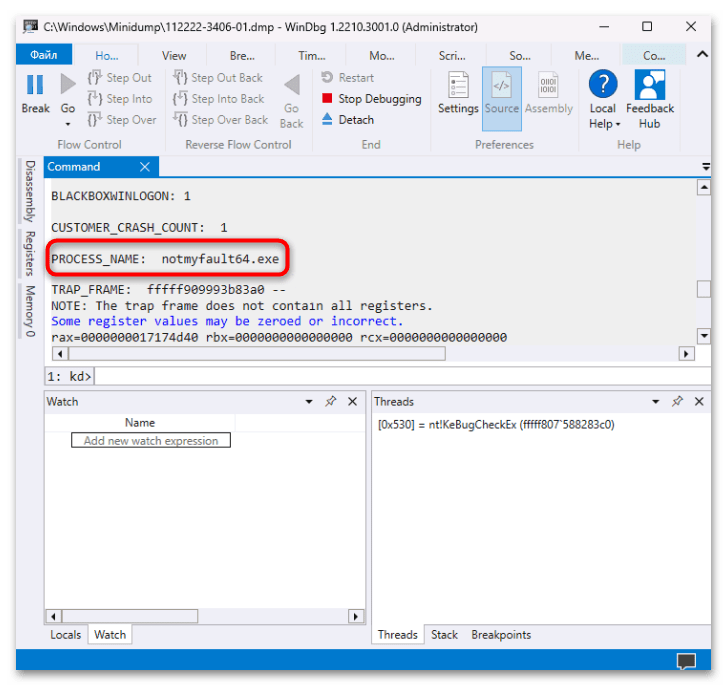
!analyze -vи нажмите на «Enter» для ее выполнения. - После в основной части окна появится информация об ошибке, вызывавшей сбой. Обратите внимание на строку «PROCESS_NAME», где указано название программы, являющейся причиной появления BSOD и записи дампа памяти.
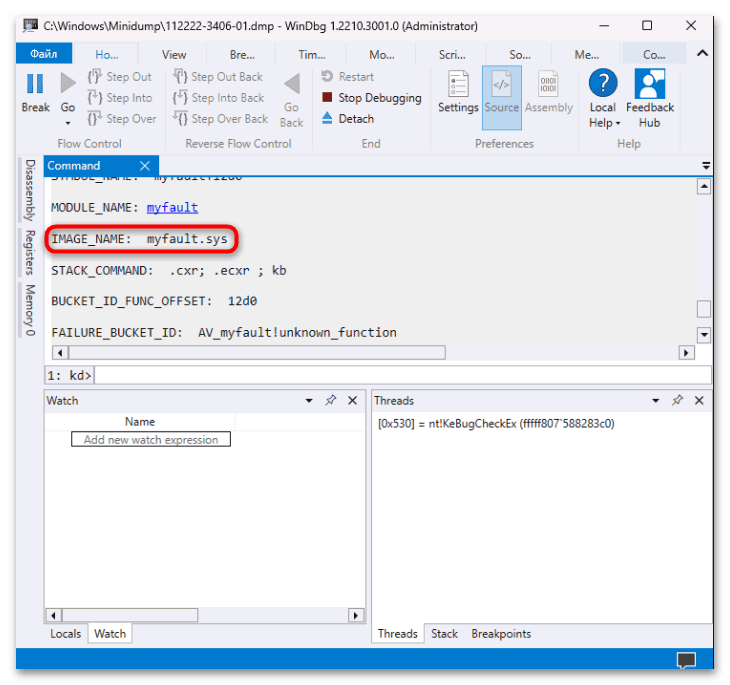
- Также нужные сведения могут быть связаны с файлом драйвера с расширением SYS (строка «IMAGE_NAME»).
После того как причина создания дампа памяти станет известна, более детальные сведения можно найти в интернете. Например, вы сможете узнать, каким устройствам соответствуют проблемные драйверы, или выяснить назначение процессов, вызвавших сбой в работе ОС.
К примеру, если стало понятно, что проблема кроется в конкретном программном обеспечении, то его может потребоваться переустановить или вовсе удалить и заменить на аналогичный софт. Если же дамп был создан вследствие неполадок с драйвером, его, может быть, понадобится обновить или выполнить переустановку ПО на текущую либо предыдущую версию.
Также для анализа ошибок BSOD есть и другие программы от сторонних разработчиков, например BlueScreenView. Как пользоваться этим софтом, мы писали ранее в отдельном руководстве.
Подробнее: Как пользоваться BlueScreenView в Windows 10
Наша группа в TelegramПолезные советы и помощь
In the realm of Windows troubleshooting and system analysis, expert picks often revolve around tools and techniques that provide the deepest insights into system behavior. Among these, the analysis of crash reports stands out as a critical practice. These reports, generated when Windows encounters a fatal error, offer a snapshot of the system’s state at the moment of failure. And at the heart of these reports lies a crucial file: the memory.dmp. Experts rely on the comprehensive data contained within the memory.dmp file to understand the underlying causes of system crashes, diagnose system faults, and ultimately improve the overall user experience. This article will delve into the intricacies of memory.dmp files, exploring their structure, generation, analysis, and significance in the world of Windows system administration.
Section 1: Overview of memory.dmp
The memory.dmp file, often referred to as a memory dump file, is a snapshot of the computer’s physical memory (RAM) at the time of a system crash, also known as a Blue Screen of Death (BSOD). Think of it like a photograph taken at the precise moment something goes wrong, capturing all the details that might be relevant to understanding the cause. This “photograph” contains a wealth of information, including running processes, loaded drivers, kernel data structures, and more.
What is a Memory Dump?
At its core, a memory dump is a file that records the contents of system memory at a specific point in time. In the context of Windows, this typically occurs when the operating system encounters an unrecoverable error, leading to a system crash. The primary purpose of creating a memory.dmp file is to provide developers and system administrators with valuable debugging information that can be used to diagnose and fix the underlying issues causing the crashes. Without this information, troubleshooting BSODs would be significantly more difficult, often relying on guesswork and trial-and-error.
Circumstances of Creation: The Blue Screen of Death (BSOD)
The most common trigger for the creation of a memory.dmp file is the dreaded Blue Screen of Death (BSOD). This error screen, formally known as a “Stop Error,” appears when Windows encounters a critical error that it cannot recover from. This could be due to a malfunctioning driver, a hardware failure, a critical system process crashing, or a variety of other issues.
When a BSOD occurs, Windows attempts to save the contents of memory to a memory.dmp file before shutting down. This allows for post-mortem analysis of the system’s state at the time of the crash. The BSOD itself provides some initial clues, such as the Stop Error code (e.g., STOP 0x0000007E) and the name of the offending driver or module (if identifiable). However, the memory.dmp file contains significantly more detailed information that can be used to pinpoint the root cause of the problem.
Imagine a car crash. The BSOD is like seeing the wreckage – you know something bad happened. The memory.dmp is like the black box recorder, providing detailed data about speed, braking, and engine performance right before the impact.
Types of Memory Dump Files
Windows offers several types of memory dump files, each with varying levels of detail and file sizes. The type of dump file created depends on the system configuration and the severity of the crash. Here’s a breakdown of the most common types:
-
Complete Memory Dump: This is the most comprehensive type of memory dump, containing the entire contents of physical memory at the time of the crash. As a result, complete memory dumps can be quite large, often several gigabytes in size, depending on the amount of RAM installed in the system. This type of dump provides the most detailed information for debugging complex issues but requires significant storage space.
-
Kernel Memory Dump: This option captures only the kernel-mode memory, which includes the operating system kernel, device drivers, and other low-level components. This is a good compromise between detail and size. The file size is smaller than a complete memory dump but still contains enough information to diagnose many common issues, such as driver problems and kernel-level bugs.
-
Small Memory Dump (Minidump): Minidumps are the smallest type of memory dump, typically containing only a limited amount of information, such as the Stop Error code, the loaded drivers, and a stack trace of the crashing thread. These files are significantly smaller than kernel or complete memory dumps, making them easier to store and share. While they don’t contain as much detail, minidumps can often provide enough information to identify the general area of the problem, such as a specific driver or module. They are often stored in the
C:\Windows\Minidumpfolder. Think of this as a summarized accident report, giving the key details but not the full picture.
The choice of which type of memory dump to use depends on the available storage space, the complexity of the issues being investigated, and the desired level of detail. For most users, a kernel memory dump provides a good balance between detail and size.
Section 2: The Structure of memory.dmp Files
Understanding the structure of a memory.dmp file is crucial for effectively analyzing its contents. While the file itself appears as a large, seemingly random collection of data, it is actually organized into specific sections, each containing different types of information.
Key Components of a memory.dmp File
A memory.dmp file primarily consists of two main components: the header and the dump data.
-
Header Information: The header is the first part of the file and contains metadata about the dump, such as the version of Windows, the Stop Error code, the time of the crash, and other system information. This header acts as a table of contents for the rest of the file, providing essential information for parsing and interpreting the dump data.
-
Dump Data: This section contains the actual memory contents captured at the time of the crash. The specific data included depends on the type of memory dump (complete, kernel, or small). It can include the contents of RAM, loaded modules, process information, kernel structures, and other data relevant to debugging the crash.
Organization of Information
The information within the memory.dmp file is organized in a structured manner, although it may not be immediately apparent when viewing the raw file. Debugging tools like WinDbg and BlueScreenView interpret this structure to extract meaningful information.
-
Pointers and Addresses: Memory dumps rely heavily on pointers and memory addresses. These are numerical values that indicate the location of specific data structures or code within the system’s memory. Debugging tools use these pointers to navigate the dump and locate relevant information, such as the call stack of a crashing thread or the data associated with a specific object.
-
Data Structures: The
memory.dmpfile contains various data structures that represent the state of the system at the time of the crash. These structures can include process tables, thread information, driver objects, and other kernel-level data. Understanding the layout and meaning of these structures is essential for interpreting the dump data. -
Module Information: Information about loaded modules, such as DLLs and drivers, is also stored in the
memory.dmpfile. This information includes the module’s name, version, and memory address range. This can be crucial for identifying the specific module responsible for the crash.
Visual Aids and Diagrams
While the precise structure of a memory.dmp file can be complex, a simplified diagram can help illustrate the key components:
+-----------------------+

| Header Information |

| (Version, Stop Code, |

| Timestamp, etc.) |

+-----------------------+

| |

| Dump Data |

| (Memory Contents, |

| Process Info, |

| Kernel Structures, |

| Module Info, etc.) |

| |

+-----------------------+
This diagram provides a high-level overview of the memory.dmp file’s structure, highlighting the separation between the header and the dump data.
Section 3: How Windows Generates memory.dmp Files
The generation of a memory.dmp file is a critical process that occurs automatically when Windows encounters a fatal error. Understanding this process can shed light on the factors that influence the creation and content of these files.
The Process of Generation
When Windows experiences a BSOD, the following steps generally occur:
-
Error Detection: The system detects a critical error, such as an unhandled exception, a kernel-mode bug check, or a hardware failure.
-
Stop Error Handling: The system initiates the Stop Error handling routine, which displays the Blue Screen of Death.
-
Dump File Creation: Windows attempts to create a
memory.dmpfile. The type of dump file created (complete, kernel, or small) depends on the system’s configuration. -
Memory Dump Writing: The system writes the contents of memory to the
memory.dmpfile. This process can take several minutes, depending on the amount of RAM and the speed of the storage device. -
System Restart: After the memory dump is complete (or if it fails), the system restarts.
Role of Windows Error Reporting (WER)
The Windows Error Reporting (WER) service plays a crucial role in capturing and storing crash data, including memory.dmp files. WER is a feedback mechanism that allows Microsoft to collect information about system crashes and other errors, which can be used to improve the stability and reliability of Windows.
When a crash occurs, WER collects information about the error, including the memory.dmp file (if created), event logs, and other relevant data. This information is then stored locally and, if the user has opted in, sent to Microsoft for analysis.
Configuring Dump File Creation
The creation of memory.dmp files can be configured through various settings in Windows. These settings allow you to specify the type of dump file to create, the location where the file is stored, and other parameters.
-
System Properties: The most common way to configure dump file creation is through the System Properties dialog. To access this dialog, right-click on “This PC” (or “My Computer”) and select “Properties.” Then, click on “Advanced system settings” and navigate to the “Advanced” tab. In the “Startup and Recovery” section, click on “Settings.”
This dialog allows you to choose the type of dump file to create (complete, kernel, or small), the location where the file is stored (by default,
%SystemRoot%\memory.dmp), and whether to automatically restart the system after a crash. -
Registry Settings: More advanced configuration options are available through the Windows Registry. The relevant registry keys are located under
HKEY_LOCAL_MACHINE\SYSTEM\CurrentControlSet\Control\CrashControl. These keys allow you to fine-tune the behavior of the crash dump process, such as specifying the maximum size of the dump file, enabling or disabling dump file compression, and configuring other advanced settings.
It’s important to note that disabling the creation of memory.dmp files can make it significantly more difficult to diagnose system crashes. Therefore, it’s generally recommended to leave dump file creation enabled, even if you don’t plan to analyze the files yourself. This provides a valuable record for future troubleshooting, even if you need to consult with a technical expert.
Section 4: Analyzing memory.dmp Files
Once a memory.dmp file has been created, the next step is to analyze its contents to identify the root cause of the system crash. This requires specialized tools and a good understanding of Windows internals.
Locating and Accessing memory.dmp Files
The default location for memory.dmp files is %SystemRoot%\memory.dmp, which typically translates to C:\Windows\memory.dmp. Minidump files, on the other hand, are usually stored in C:\Windows\Minidump.
To access these files, you may need administrator privileges. Also, the memory.dmp file might be in use by the system, preventing you from directly copying or moving it. In this case, you can either restart the system or use a tool like Process Explorer to identify and close the process locking the file.
Tools for Analyzing memory.dmp Files
Several tools are available for analyzing memory.dmp files, each with its own strengths and weaknesses. Here are some of the most popular options:
-
WinDbg (Windows Debugger): WinDbg is a powerful debugging tool developed by Microsoft. It’s part of the Debugging Tools for Windows package and is widely used by developers and system administrators for advanced debugging tasks, including analyzing
memory.dmpfiles. WinDbg provides a command-line interface and a wide range of features for inspecting memory, disassembling code, and tracing execution. It requires a good understanding of debugging concepts and Windows internals but offers the most flexibility and control over the analysis process. -
BlueScreenView: BlueScreenView is a free tool developed by NirSoft. It’s designed specifically for analyzing minidump files and provides a user-friendly interface for viewing the Stop Error code, the loaded drivers, and other relevant information. BlueScreenView is a good option for beginners who want a quick and easy way to get a basic overview of the crash.
-
Microsoft’s Debugging Tools for Windows: This is a comprehensive suite of debugging tools provided by Microsoft. It includes WinDbg, as well as other tools for debugging applications, drivers, and the operating system itself. The Debugging Tools for Windows package is a must-have for anyone serious about debugging Windows systems.
Extracting Meaningful Information
Analyzing a memory.dmp file involves extracting meaningful information from the raw data. This typically involves the following steps:
-
Loading the Dump File: Open the
memory.dmpfile in the debugging tool of your choice (e.g., WinDbg or BlueScreenView). -
Analyzing the Stop Error Code: The Stop Error code (e.g.,
STOP 0x0000007E) provides a general indication of the type of error that occurred. Look up the Stop Error code in the Microsoft documentation to get more information about its meaning. -
Identifying the Crashing Thread: The
memory.dmpfile contains information about the threads that were running at the time of the crash. Identify the thread that was responsible for the crash (often indicated by the Stop Error code). -
Examining the Call Stack: The call stack shows the sequence of function calls that led to the crash. This can help you identify the specific function or module that caused the error.
-
Inspecting Memory Contents: Use the debugging tool to inspect the contents of memory around the crashing address. This can provide valuable clues about the state of the system at the time of the crash.
-
Identifying the Offending Module: Based on the call stack and memory contents, identify the module (e.g., driver or DLL) that was responsible for the crash.
Example Scenario:
Let’s say you analyze a memory.dmp file and find a Stop Error code of 0x000000D1 (DRIVER_IRQL_NOT_LESS_OR_EQUAL). This error typically indicates that a driver attempted to access memory at an invalid IRQL (Interrupt Request Level). By examining the call stack, you might find that the crashing function belongs to a specific network driver (e.g., MyNetworkDriver.sys). This would suggest that the network driver is the cause of the crash.
Analyzing memory.dmp files can be a complex and time-consuming process, but it’s often the only way to identify the root cause of elusive system crashes.
Section 5: Common Causes of System Crashes
Analyzing memory.dmp files often reveals recurring patterns and common causes of system crashes. Understanding these common causes can help you troubleshoot issues more efficiently.
Hardware-Related Problems
Hardware failures are a frequent cause of BSODs. Some common hardware-related issues include:
-
Faulty RAM: Defective RAM modules can cause a wide range of problems, including memory corruption, application crashes, and system instability. Memory diagnostic tools like Memtest86+ can be used to test the integrity of RAM modules.
-
Overheating Components: Overheating CPUs, GPUs, or other components can lead to system crashes. Ensure that cooling solutions are adequate and that fans are functioning properly.
-
Hard Drive Failures: Failing hard drives can cause data corruption and system instability. Regularly check the health of your hard drives using SMART monitoring tools.
-
Power Supply Issues: An inadequate or failing power supply can cause unpredictable system behavior, including crashes. Ensure that your power supply is sufficient for your system’s components and that it’s functioning properly.
Software-Related Issues
Software bugs and conflicts are another common cause of system crashes. Some common software-related issues include:
-
Driver Conflicts: Incompatible or outdated drivers are a frequent cause of BSODs. Ensure that you have the latest drivers for all your hardware components.
-
Software Bugs: Bugs in applications or the operating system itself can lead to system crashes. Keep your software up to date with the latest patches and updates.
-
Malware Infections: Malware can cause a wide range of problems, including system instability and crashes. Run regular scans with a reputable antivirus program.
-
Operating System Corruption: Corruption of the operating system files can lead to system crashes. Run the System File Checker (SFC) tool to scan for and repair corrupted system files.
Real-World Scenarios and Case Studies
-
Scenario 1: A user experiences frequent BSODs with the Stop Error code
0x00000050(PAGE_FAULT_IN_NONPAGED_AREA). Analyzing thememory.dmpfile reveals that the crashing address is consistently within the memory range of a specific video driver. This suggests that the video driver is faulty or incompatible. -
Scenario 2: A system crashes with the Stop Error code
0x0000007E(SYSTEM_THREAD_EXCEPTION_NOT_HANDLED). Analyzing thememory.dmpfile shows that the crashing thread is related to a third-party firewall application. This suggests that the firewall application is causing the crash.
By analyzing memory.dmp files and understanding common causes of system crashes, you can effectively diagnose and resolve a wide range of issues.
Section 6: Importance of memory.dmp in System Recovery
Memory.dmp files are not just for developers and system administrators; they play a vital role in overall system recovery and stability.
Crucial Role for IT Professionals and System Administrators
For IT professionals and system administrators, memory.dmp files are indispensable tools for diagnosing and resolving system issues. They provide the detailed information needed to identify the root cause of crashes, which can then be addressed through driver updates, software patches, hardware replacements, or configuration changes.
Without memory.dmp files, troubleshooting system crashes would be significantly more challenging, often relying on guesswork and trial-and-error. This can lead to prolonged downtime, increased support costs, and frustrated users.
Improving System Stability and User Experience
By analyzing memory.dmp files and addressing the underlying causes of system crashes, you can significantly improve system stability and user experience. This can lead to fewer crashes, reduced downtime, and increased user satisfaction.
Furthermore, analyzing crash reports can help identify recurring issues that may be affecting multiple users or systems. This allows you to proactively address these issues before they cause widespread problems.
Importance of Keeping a Log of memory.dmp Files
Maintaining a log of memory.dmp files can be invaluable for tracking recurring issues and identifying patterns. This can help you identify systemic problems that may be affecting multiple systems or users.
For example, if you notice that a specific Stop Error code is consistently appearing in crash reports across multiple systems, this may indicate a widespread driver incompatibility or a software bug that needs to be addressed.
Keeping a log of memory.dmp files also allows you to track the effectiveness of your troubleshooting efforts. By comparing crash reports before and after implementing a fix, you can verify that the issue has been resolved and that the system is now stable.
Section 7: Recent Developments and Future Trends
The field of crash reporting and system diagnostics is constantly evolving, with recent advancements in technology leading to new and improved methods for analyzing memory.dmp files and preventing system crashes.
Recent Advancements in Windows Crash Handling
Microsoft has made significant improvements to the way Windows handles crash reports and memory dumps in recent versions of the operating system. These improvements include:
-
Improved Error Reporting: Windows now provides more detailed and informative error messages in the Blue Screen of Death, making it easier to identify the potential cause of the crash.
-
Enhanced Memory Dump Creation: The process of creating
memory.dmpfiles has been optimized to reduce the time it takes to write the dump file and minimize the impact on system performance. -
Integration with Cloud Services: Windows now integrates with cloud-based services to provide more comprehensive crash analysis and troubleshooting assistance.
Integration of AI and Machine Learning
AI and machine learning are increasingly being used to analyze crash reports and improve system resilience. These technologies can be used to:
-
Automatically Identify Root Causes: AI algorithms can analyze
memory.dmpfiles and automatically identify the root cause of system crashes, reducing the need for manual analysis. -
Predict System Failures: Machine learning models can be trained to predict system failures based on historical crash data, allowing you to proactively address potential issues before they cause a crash.
-
Optimize System Performance: AI can be used to optimize system performance and prevent crashes by dynamically adjusting system settings and resource allocation.
Future Trends in Crash Reporting and System Diagnostics
Looking ahead, the future of crash reporting and system diagnostics is likely to be shaped by the following trends:
-
Increased Automation: AI and machine learning will play an increasingly important role in automating the analysis of crash reports and identifying the root cause of system crashes.
-
Cloud-Based Analysis: Cloud-based services will become more prevalent for analyzing crash reports and providing troubleshooting assistance.
-
Proactive Monitoring: Proactive monitoring tools will be used to detect potential system failures before they cause a crash.
-
Self-Healing Systems: Systems will become more self-healing, automatically detecting and resolving issues without requiring user intervention.
These advancements will lead to more stable, reliable, and user-friendly computing experiences.
Conclusion
Understanding memory.dmp files is a critical skill for anyone involved in troubleshooting and maintaining Windows systems. These files provide a wealth of information about the system’s state at the time of a crash, allowing you to identify the root cause of the issue and take corrective action.
From understanding the different types of memory dumps to using specialized tools like WinDbg and BlueScreenView, this article has provided a comprehensive overview of memory.dmp files and their role in system recovery.
As technology continues to evolve and systems become increasingly complex, the need for effective diagnostic tools like memory.dmp files will only grow. By mastering the art of analyzing crash reports, you can ensure the stability and reliability of your Windows systems and provide a better user experience for everyone.
Learn more
Это маленькая заметка о том, какие шаги необходимо выполнить для получения первичной информации об исполняемом файле, ставшем возможной причиной остановки работы операционной системы Windows — Blue Screen of Death (BSOD). По умолчанию ОС Windows настроена таким образом, что при возникновении ошибки приводящей к полной остановке работы системы, автоматически создаётся аварийный дамп памяти в виде файла MEMORY.DMP. Чтобы получить доступ к информации из этого файла, нам потребуется набор отладочных утилит Debugging tools for Windows из состава Windows Software Development Kit.
Переходим по ссылке WDK and WinDbg downloads и скачиваем онлайн-инсталлятор/загрузчик Standalone Debugging Tools for Windows (WinDbg) – файл sdksetup.exe. Запускаем инсталлятор и выбираем вариант установки…

На следующем шаге выбора компонент к установке (Select the features you want to install) отмечаем только то, что нам нужно — Debugging tools for Windows и нажимаем Install

В указанную на первом экране папку из Интернета будет загружен и установлен набор утилит.
После окончания установки находим в меню “Пуск” или на стартовом экране в группе ярлыков Windows Kits утилиту WinDbg и запускаем её с правами администратора

Если по какой-то причине ярлык найти не удалось, то можно запустить исполняемый файл из каталога установки — С:\Program Files (x86)\Windows Kits\8.1\Debuggers\x64\windbg.exe
В главном меню программы WinDbg выбираем пункты File > Symbol File Path. В открывшееся окно вставляем строку определяющую пусть к локальному каталогу символьного кэша и его онлайн-источнику:
SRV*C:\Windows\symbol_cache*http://msdl.microsoft.com/download/symbols

Сохраняем настройки, выбрав в главном меню пункты File > Save Workspace
Открываем файл дампа памяти, выбрав в меню File > Open Crash Dump…
Выбираем файл MEMORY.DMP (по умолчанию расположен в каталоге C:\Windows) и нажимаем Open

Появится информация о том, какой именно исполняемый модуль стал причиной остановки работы системы. Щёлкнув по гиперссылке !analyze-v можно получить более развернутую информацию о состоянии системы на момент возникновения стоп-ошибки.
Туже самую информацию можно получить и с помощью командной строки используя примерно следующую последовательность команд:
cd /d "C:\Program Files (x86)\Windows Kits\8.1\Debuggers\x64\"
kd -z "D:\DOWNLOADS\VM05\MEMORY.DMP"
.logopen C:\Debuglog.txt
.sympath srv*C:\Windows\symbol_cache*http://msdl.microsoft.com/download/symbols
В этом примере вся информация о разборе дампа будет выгружена в читаемом виде в файл C:\Debuglog.txt
Источники информации:
- KB315263 — Интерпретация содержимого малого дампа памяти, создаваемого Windows для отладки
- Scott Forsyth — Reading a memory.dmp or other .dmp file
If your system has crashed and experienced a Blue Screen of Death (BSoD), or a program or Windows feature suddenly crashes, Windows automatically generates a record of the conditions and circumstances under which the error occurred. This information is stored in dump files with the extension “.dmp.”
These dump files can help troubleshoot the root cause of the error so that it does not occur again.
This article contains everything you need to know about these dump files and how they can be opened in Windows, since there is no native method, so they can be analyzed to determine the cause of the error.
Table of Contents
Windows Crash Dump Files
Crash dump files, also known as “mini-dump files,” are system-generated binary files that contain various information about a crash that may have occurred on your computer. Like Event Viewer, these files can be used to determine the cause of the error, and then use that data to fix it. Dump files can contain the following data in them, which can be helpful for the matter:
The list below highlights the content which can be found inside a mini-dump file.
- The Stop message (error code), its parameters, and other data.
- List of loaded drivers.
- The processor context (PRCB) for the processor that stopped.
- Process information and kernel context (EPROCESS) for the process stopped.
- Process information and kernel context (ETHREAD) for the thread stopped.
- Kernel-mode call stack for the thread that stopped.
Dump files are created by copying the data off the system memory and onto the computer’s storage. It uses the Windows Page File and requires at least 2MB of free space. With this information, you can understand how different dump files are created.
Windows can write debugging information in three types of dump files.
Types of Dump Files
Complete Memory Dump
Complete Memory Dump files are the largest of the dump files. In this case, the complete contents of the memory are written onto the dump file.
When generated by the system, all old Complete Memory Dump files are replaced and overwritten.
Complete Memory Dump files are saved to C:\Windows\MEMORY.DMP file.
Kernel Memory Dump
Kernel Memory Dump files only contain data from kernel memory, which is why they are relatively smaller in size. Such files do not contain data from any unused, unallocated memory or the memory used by user-mode programs.
When generated by the system, all old Kernel Memory Dump files are replaced and overwritten.
Kernel Memory Dump files are also saved to C:\Windows\MEMORY.DMP file, the same as Complete Memory Dump files. However, only one of these is saved at a time and is overwritten when another crash occurs.
Small Memory Dump/Mini Memory Dump
The minidump file, which we will discuss in this post, is the smallest kind of dump file. This file contains the information described above that can assist in determining the cause of the crash.
Minidump files generated by the system are not overwritten. Instead, a new one is generated.
Minidump files can be found at C:\Windows\Minidump. If you do not find a directory named “Minidump,” it is likely because a dump file has not been created yet.
When a minidump file is created, Windows automatically includes the date it was created on. For example, in Windows 11, if a file is named “020322-18890-01.dmp,” “02” indicates the month, “03” indicates the date, and “22” indicates the year the file was created. “-01” at the end indicates it was the first dump file created that day.
The same is true for a minidump file created in Windows 10, which is automatically named something like “mini020322-01.dmp.”
Now let’s move on to opening and analyzing a dump file.
How to Read and Analyze DMP Files
As we mentioned, Windows does not allow you to open dump files directly. However, you can use other tools available online to open and analyze them. One of the most common tools to do so is through the Windows Debugging (WinDbg) tool, which can be downloaded through Microsoft Store. Continue reading the given guide below to use this tool to open and analyze memory dump files in Windows.
Using WinDbg
We have divided this section into 2 parts: Downloading and installing the WinDbg tool and then using it to analyze a dump file.
Download and Install WinDbg
- Open the WinDbg Preview page in the Microsoft Store and click Get.

- The browser will prompted you to open the Microsoft Store app, click Open Microsoft Store.
- From the Store app, click Get again.


The WinDbg tool will now begin to download and then install. We are now done with the installation phase. Let us now use the tool to open and analyze dump files.
Open and Analyze dmp files using WinDbg
- Open the WinDbg tool with administrative rights by searching for it through the search box, right-clicking it, and then clicking Run as administrator from the context menu.

- From the WinDbg tool, click File from the top menu.
- In the Start Debugging tab, click Open dump file.

- Now click Browse from the right pane within the tool and select the dump file that you want to analyze by navigating to
C:\Windows\Minidump. When selected, click Open.
- The tool will now open the dump file, which can take a few minutes. When the dump file successfully opens, type in the following command in the text field in front of “0: kd>“:
!analyze -v
- WinDbg will now begin analyzing the dump file. This can take a few minutes to complete. Once completed, you should see the results in the top window.


In the example above, since we initiated a BSoD intentionally, it states “The user manually initiated this crash dump.” Otherwise, if it were an actual error, you would see different statements and information after performing the analysis of the dump file.
You can then use this information to troubleshoot the error that caused the crash.
Using WhoCrashed
Download WhoCrashed

WhoCrashed is available in both free and paid editions. However, the free edition is sufficient to open and analyze dump files. With this tool, you can obtain reports on the dump files with a single click. The tool will automatically scan your system files for any .dmp files and fetch the data within.
To do so, download WhoCrashed from the link given above, and run the .exe file to install in a few easy steps. Once installed, click Analyze from the ribbon menu at the top. The tool will then take a few seconds to scan any dump files and present the analysis. You can also view the .dmp files discovered from the Dump files tab.
Using BlueScreenView
Download BlueScreenView

BlueScreenView is a portable and small tool that can provide you with relevant information on minidump files. When you run this tool, it automatically picks up any .dmp files in the Minidump directory and displays the relevant information gathered from them. If there are multiple .dmp files, you can click on the one you want to analyze from the top field within the tool, and the information is presented in the bottom one.
Simply download the app from the link given above, extract the content and run the BlueScreenView application.
Final Thoughts
Dump files, regardless of their type, can be pretty useful when it comes to troubleshooting your operating system. However, the methods we have used above to analyze them may not be everyone’s cup of tea, as some of you may find them complex.
That said, there are more methods to analyze dump files using tools, but they involve using the Command prompt, not a Graphical User Interface (GUI). If you’d still like to learn more about it, you can read this detailed post by Microsoft on memory dump files.