
by |
Published on
category C / C++
Memory profiling C++ is a complicated topic. Based on the level of complexity of the language it is also one of the most important topics to consider. This is due to the lack of a garbage collector and the power that you as a developer will have with the language. As they say with great power comes great responsibility.
For games, you would also want to structure and analyze your memory carefully so that your games stay within a set budget – especially when you are developing for game consoles which may have lower specs than your average PC.
Table of Contents
- Why would I need to profile on Windows?
- Example memory leak
- Using Windows’s CRT library for memory profiling
- Visual Studio tools – memory usage profiling
- MTuner – a memory profiling tool
- Conclusion
Why would I need to profile on Windows?
The most popular memory profiler in the C++ world is called Valgrind. The problem is though that it is only available on Linux-based operating systems. Games though (especially for consoles) are developed on Windows and you would need a tool for reliably profiling your applications and games.
Also, C++ is a complicated language in terms of managing memory and you will often forget to release objects from your RAM causing the so-called memory leak. Memory leaks could be caught using simply your programming skills but they are quite tricky even for an experienced programmer to fix.
Example memory leak
Memory leaks are one of the most important things you would want to look for in a program. They might be quite tricky to get sometimes. It is very important to have a clear structure in your program which class should handle the memory allocation and release for a certain other class. This can be achieved trivially by using shared_ptr, weak_ptr and unique_ptr from the standard library. To learn more on the topic I would suggest you watch some of the videos of The Cherno like this one about pointers.
I have an example code that is badly written for the purpose of this article. Let’s say we have the code to calculate factorials. We also want to have a counter that is passed between the function. It counts every time we pass by a value of n that is a multiple of 5. I have made a leak in the code on purpose. Every time we meet that number we create a new counter object. We then copy that object into the previous one. But we will also leave the newly created object unreleased from memory – a leak.
#include <iostream>

struct Counter {
    int value;
};

long factorial(short n, Counter& counter)
{
    if(n % 5 == 0)
    {
        Counter* otherCounter = new Counter();
        otherCounter->value = counter.value + 1;
        counter = *otherCounter; // Copied but also left unreleased
    }

    if(n > 0)
    {
        return n * factorial(n - 1, counter);
    }

    return 1;
}

int main()
{
    Counter* counter = new Counter();
    std::cout << factorial(10, *counter) << std::endl;
    std::cout << counter->value << std::endl;
    return 0;
}
Using Windows’s CRT library for memory profiling
The first option that you can try when debugging your memory usage is to add some code that will profile it for you. It is as simple as adding just a few lines of code and then running the application. You could also do a more sophisticated profile of your code for certain points of the application or per game frame.
The simplest option would be to add the necessary header files and just some setup code inside the start of your main method:
#define _CRTDBG_MAP_ALLOC
#include <stdlib.h>
#include <crtdbg.h>
int main()
{
//...
_CrtSetDbgFlag ( _CRTDBG_ALLOC_MEM_DF | _CRTDBG_LEAK_CHECK_DF ); // This is used to auto output memory information about leaks before closing the application
_CrtSetReportMode( _CRT_WARN, _CRTDBG_MODE_DEBUG ); // Set to output into your IDE's debug window
//...
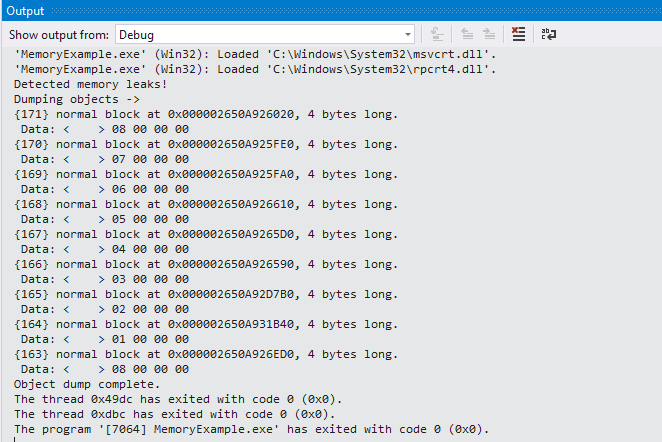
}This example code is the minimum I would advise you to always use whenever working with C++. It would detect basic memory leaks when your application closes helping you identify that a problem exists closer in time to when it was introduced. An example output as shown in Visual Studio’s output window would be:
To extend this further you would probably want to make snapshots at specific points which you can compare. To do this it is pretty basic on top of the includes we added above:
_CrtMemState oldState;
_CrtMemState newState;
_CrtMemState stateDiff;

_CrtMemCheckpoint(&oldState);

// ... Do some memory action

_CrtMemCheckpoint(&newState);

if (_CrtMemDifference(&stateDiff, &oldState, &newState))
{
    // Simple statistics between the state
    _CrtMemDumpStatistics(&stateDiff);

    // Dump all created objects
    _CrtMemDumpAllObjectsSince(&oldState);

    // Dump the memory leaks up until now
    _CrtDumpMemoryLeaks();
}
As you can see you can capture snapshots for memory profiling that will help you investigate certain points of your application.
This method is usable in multiple IDEs though it was a bit hidden in CLion where I also tested it. I found the output information inside the Debugger tab’s LLDB section.
First I want to quickly dismiss the concept that VS will help you much with memory profiling. Visual Studio 2019 has a nice set of tools for analyzing the memory usage of an application but you will mostly get so far as you would with the method described above. You can pretty much check the memory usage at different points in the execution of the application while debugging. This is done through the “Diagnostic Tools” window.
This is better shown with an image than described:
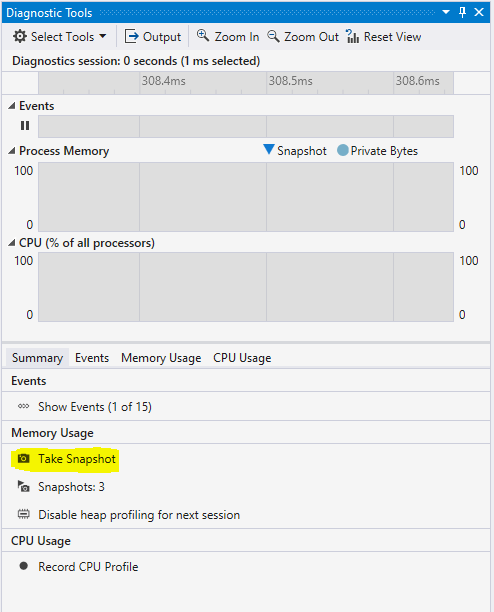
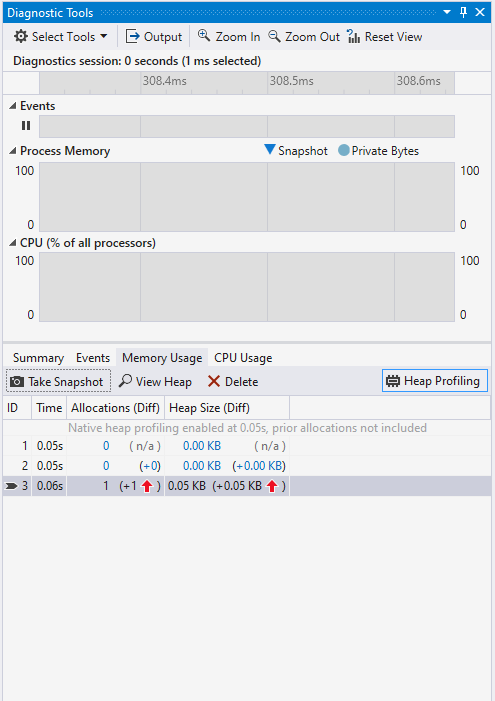
You will be able to take snapshots and compare how the memory usage has changed from point A to point B. But that is pretty much the extent of it. Maybe one more thing is that there is a useful “View Heap” button that will show you the type of the allocated classes between each snapshot.
A nice application that does memory profiling on windows is MTuner. It is an open-sourced project. I was really amazed by the power of that application. It is a simple to use application that you start and then you drag and drop the application you want to profile. It will immediately execute that application and provide you with information about its memory.

Just by looking at the first window that opens, we can see that our MemoryExample application has only allocations and no memory is ever freed. It also has a timeline view of all allocations and stack traces of when and where they happen.
This project was a life saver for me and I strongly recommend it in front of all other solutions. It is non-invasive. It doesn’t require you to implement any code for it to run. You just need to drag and drop your application and that is it. Consider contributing or supporting the project in any way as the tools available for windows are pretty sparse.
Conclusion
This was a short article on memory profiling for Windows but I hope that anyone out there finds it useful. I sometimes find it hard to find information on such simple topics for the C/C++ language. I was surprised that memory profiling is not that well explained or supported on the Windows front. CLion is supporting only Valgrind out-of-the-box and Visual Studio’s integrated memory profiling is only a memory usage visualizer.
For other interesting topics in the world of C/C++ development, you can check out some interesting articles about build automation or how to get started with CMake for project structuring.

MTuner is a C/C++ memory profiler and memory leak finder for Windows, PlayStation 3/4/5, Nintendo Switch, Android and other platforms.
MTuner utilizes a novel approach to memory profiling and analysis, keeping entire time-based history of memory operations. This gives an unique insight in memory related behavior of your software by making queries over the entire data set.
While MTuner was created for profiling C/C++ applications, it is possible to profile memory for programs written in other languages as long as there is corresponding debug symbol information. Users can convert DMD CodeView/DWARF debug symbols to PDB format using cv2pdb.

Source Code
You can get the latest source code by cloning it from github:
git clone https://github.com/RudjiGames/MTuner.git
After cloning, we need to download dependencies:
git submodule init
git submodule update
Download
Binaries can be downloaded from releases page
NB: If your application crashes while being profiled with MTuner, you can try adding MTuner folder to ‘Exclusions’ list under ‘Virus & threat protection settings’
Documentation
MTuner documentation can be found here.
Build
MTuner uses Qt framework for user interface so it needs to be installed on the build machine. The build system is based on GENie and build in order to dramatically simplify managing build configurations and dependencies.
After cloning the repository and dependencies, here are the steps to build MTuner.
MinGW
$ cd MTuner/genie
$ genie --gcc=mingw-gcc gmake
$ cd ../../.build/windows/mingw-gcc/MTuner/projects/
$ make
MINGW environment variable must be set and point to the MinGW installation directory.
Tested with TDM64 MinGW using OpenMP package
Visual Studio
> cd MTuner/genie
> genie vs2022
Solution will be located here: {Clone root}/.build/windows/vs2022/projects/MTuner/MTuner.sln
NB: building Qt based projects with build requires Lua to be installed.
Environment variables are used to locate Qt installation, example:
set QTDIR_VS2022_x86=C:\<some_path>\Qt\6.3.1\msvc2019_64 *
set QTDIR_VS2022_x64=C:\<some_path>\Qt\6.3.1\msvc2019_64
* Note that Qt deprecated 32bit builds which is why both variables point to same location.
License (BSD 2-clause)
Copyright 2023 Milos Tosic. All rights reserved.

https://github.com/RudjiGames/MTuner

Redistribution and use in source and binary forms, with or without
modification, are permitted provided that the following conditions are met:

   1. Redistributions of source code must retain the above copyright notice,
      this list of conditions and the following disclaimer.

   2. Redistributions in binary form must reproduce the above copyright
      notice, this list of conditions and the following disclaimer in the
      documentation and/or other materials provided with the distribution.

THIS SOFTWARE IS PROVIDED BY COPYRIGHT HOLDER ``AS IS'' AND ANY EXPRESS OR
IMPLIED WARRANTIES, INCLUDING, BUT NOT LIMITED TO, THE IMPLIED WARRANTIES OF
MERCHANTABILITY AND FITNESS FOR A PARTICULAR PURPOSE ARE DISCLAIMED. IN NO
EVENT SHALL COPYRIGHT HOLDER OR CONTRIBUTORS BE LIABLE FOR ANY DIRECT,
INDIRECT, INCIDENTAL, SPECIAL, EXEMPLARY, OR CONSEQUENTIAL DAMAGES
(INCLUDING, BUT NOT LIMITED TO, PROCUREMENT OF SUBSTITUTE GOODS OR SERVICES;
LOSS OF USE, DATA, OR PROFITS; OR BUSINESS INTERRUPTION) HOWEVER CAUSED AND
ON ANY THEORY OF LIABILITY, WHETHER IN CONTRACT, STRICT LIABILITY, OR TORT
(INCLUDING NEGLIGENCE OR OTHERWISE) ARISING IN ANY WAY OUT OF THE USE OF
THIS SOFTWARE, EVEN IF ADVISED OF THE POSSIBILITY OF SUCH DAMAGE.

Временами бывает нужно отпрофилировать производительность программы или потребление памяти в программе на C++. К сожалению, зачастую это сделать не так просто как может показаться.
Здесь будут рассмотрены особенности профилирования программ с использованием инструментов valgrind и google perftools. Материал получился не очень структурированным, это скорее попытка собрать базу знаний «для личных целей», чтобы в будущем не приходилось судорожно вспоминать, «а почему не работает то» или «а как сделать это». Скорее всего, здесь будут затронуты далеко не все неочевидные случаи, если вам есть что добавить, пишите пожалуйста в комментарии.
Все примеры будут запускаться в системе linux.
Профилирование времени выполнения
Подготовка
Для разбора особенностей профилирования я буду запускать небольшие программки, как правило состоящие из одного main.cpp файла и одного файла func.cpp вместе с инклудом.
Компилировать их я буду компилятором g++ 8.3.0.
Так как профилировать неоптимизированные программы — довольно странное занятие, будем компилировать с опцией -Ofast, а для того, чтобы получить debug-символы на выходе, не забудем добавить опцию -g. Тем не менее, иногда вместо нормальных имен функций можно увидеть только невнятные адреса вызовов. Это значит, что произошла «рандомизация размещения адресного пространства». Это можно определить, вызывав команду nm на бинарнике. Если в большинство адресов выглядят примерно так 00000000000030e0 (большое количество нулей в начале), то скорее всего это оно. В нормальной программе адреса выглядят как 0000000000402fa0. Поэтому нужно добавить опцию -no-pie. В результате, полный набор опций будет выглядеть вот так:
-Ofast -g -no-pie
Для просмотра результатов будем использовать программу KCachegrind, который умеет работать с форматом отчетов callgrind
Callgrind
Первая утилита, которую мы сегодня рассмотрим — callgrind. Эта утилита входит в состав инструмента valgrind. Она эмулирует каждую исполняемую инструкцию программы и на основании внутренних метрик о «стоимости» работы каждой инструкции выдает нужное нам заключение. Из-за такого подхода иногда бывает так, что callgrind не может распознать очередую инструкцию и вываливается с ошибкой
Unrecognised instruction at address
Единственный выход из такой ситуации — пересмотреть все опции компиляции и попытаться найти мешающую
Давайте для тестирования этого инструмента создадим программу, состоящую из одной shared, и одной static библиотеки (в дальнейшем в других тестах от библиотек откажемся). Каждая библиотека, а также сама программа, будет предоставлять простенькую вычислительную функцию, например, вычисление последовательности Фибоначчи.
static_lib
//////////////////
// static_lib.h //
//////////////////
#ifndef SERVER_STATIC_LIB_H
#define SERVER_STATIC_LIB_H

int func_static_lib(int arg);

#endif //SERVER_STATIC_LIB_H


////////////////////
// static_lib.cpp //
///////////////////
#include "static_lib.h"

#include "static_func.h"

#include <cstddef>

int func_static_lib(int arg) {
    return static_func(arg);
}


///////////////////
// static_func.h //
///////////////////
#ifndef TEST_PROFILER_STATIC_FUNC_H
#define TEST_PROFILER_STATIC_FUNC_H

int static_func(int arg);

#endif //TEST_PROFILER_STATIC_FUNC_H


/////////////////////
// static_func.cpp //
/////////////////////
#include "static_func.h"

int static_func(int arg) {
    int fst = 0;
    int snd = 1;
    for (int i = 0; i < arg; i++) {
        int tmp = (fst + snd) % 17769897;
        fst = snd;
        snd = tmp;
    }
    return fst;
}
shared_lib
//////////////////
// shared_lib.h //
//////////////////
#ifndef TEST_PROFILER_SHARED_LIB_H
#define TEST_PROFILER_SHARED_LIB_H

int func_shared_lib(int arg);

#endif //TEST_PROFILER_SHARED_LIB_H


////////////////////
// shared_lib.cpp //
////////////////////
#include "shared_lib.h"

#include "shared_func.h"

int func_shared_lib(int arg) {
    return shared_func(arg);
}


///////////////////
// shared_func.h //
///////////////////
#ifndef TEST_PROFILER_SHARED_FUNC_H
#define TEST_PROFILER_SHARED_FUNC_H

int shared_func(int arg);

#endif //TEST_PROFILER_SHARED_FUNC_H


/////////////////////
// shared_func.cpp //
/////////////////////
#include "shared_func.h"

int shared_func(int arg) {
    int result = 1;
    for (int i = 1; i < arg; i++) {
        result = (int)(((long long)result * i) % 19637856977);
    }
    return result;
}
main
//////////////
// main.cpp //
//////////////
#include <iostream>

#include "static_lib.h"
#include "shared_lib.h"

#include "func.h"

int main(int argc, char **argv) {
    if (argc != 2) {
        std::cout << "Incorrect args";
        return -1;
    }

    const int arg = std::atoi(argv[1]);

    std::cout << "result: " << func_static_lib(arg) << " " << func_shared_lib(arg) << " " << func(arg);
    return 0;
}


////////////
// func.h //
////////////
#ifndef TEST_PROFILER_FUNC_H
#define TEST_PROFILER_FUNC_H

int func(int arg);

#endif //TEST_PROFILER_FUNC_H


//////////////
// func.cpp //
//////////////
#include "func.h"

int func(int arg) {
    int fst = 1;
    int snd = 1;
    for (int i = 0; i < arg; i++) {
        int res = (fst + snd + 1) % 19845689;
        fst = snd;
        snd = res;
    }
    return fst;
}
Компилируем программу, и запускаем valgrind следующим образом:
valgrind --tool=callgrind ./test_profiler 100000000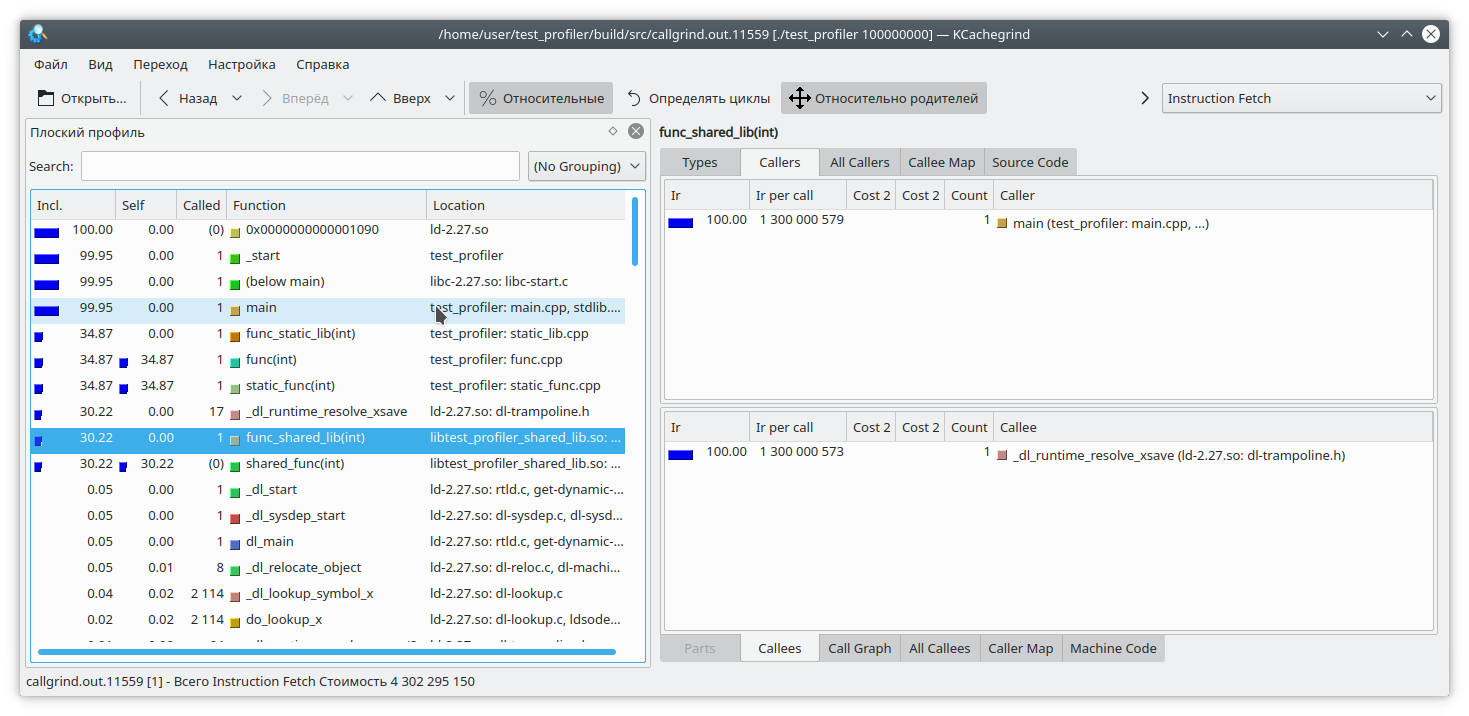
Видим, что для статической библиотеки и обычной функции результат похож на ожидаемый. А вот в динамической библиотеке callgrind не смог до конца отрезолвить функцию.
Для того, чтобы это исправить, при запуске программы нужно установить переменную LD_BIND_NOW в значение 1, вот так:
LD_BIND_NOW=1 valgrind --tool=callgrind ./test_profiler 100000000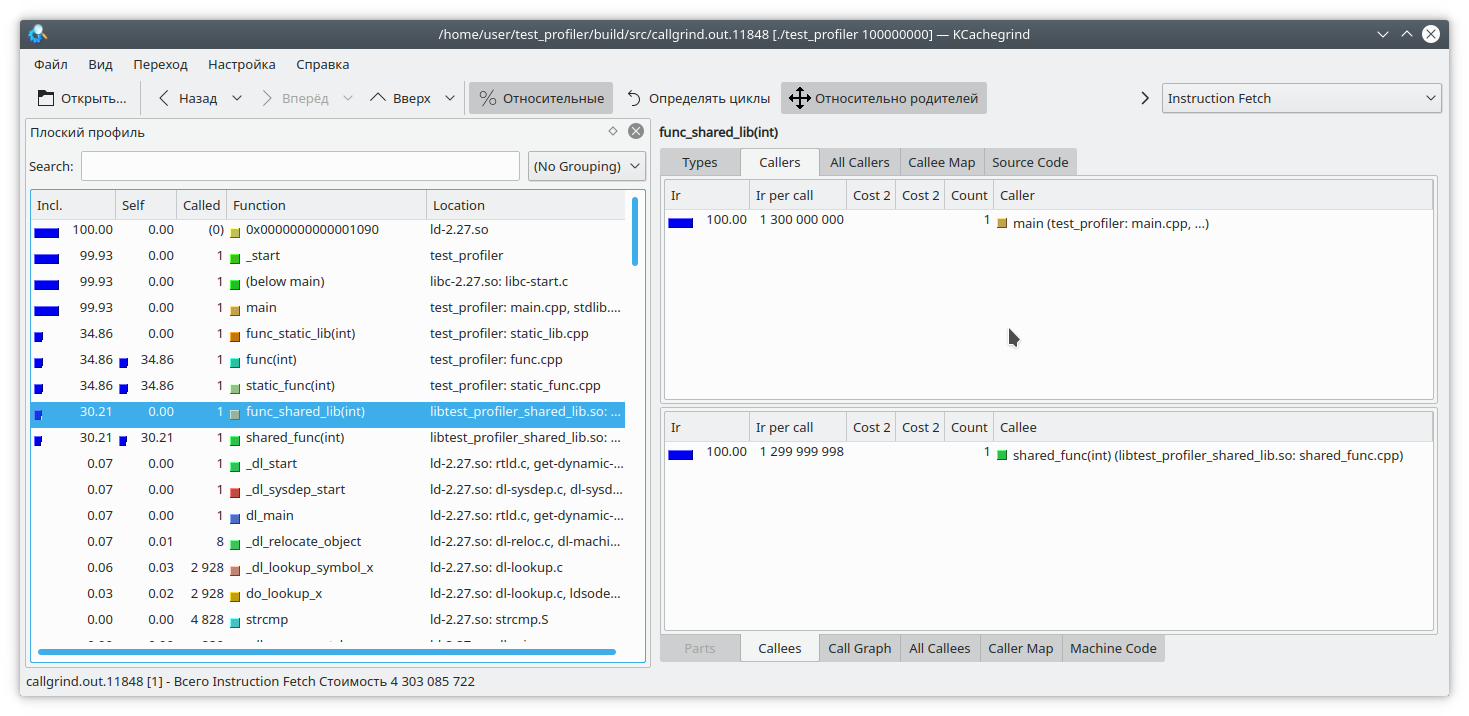
И теперь, как видите, все нормально
Следующая проблема callgrind-а, вытекающая из профилирования путем эмуляции инструкций в том, что выполнение программы сильно замедляется. Это может нести в себе неправильную относительную оценку времени выполнения различных частей кода.
Давайте рассмотрим такой код:
int func(int arg) {
    int fst = 1;
    int snd = 1;
    std::ofstream file("tmp.txt");
    for (int i = 0; i < arg; i++) {
        int res = (fst + snd + 1) % 19845689;

        std::string r = std::to_string(res);

        file << res;
        file.flush();

        fst = snd;
        snd = res + r.size();
    }
    return fst;
}
Здесь я добавил на каждую итерацию цикла запись небольшого количества данных в файл. Так как запись в файл — довольно длительная операция, для противовеса я добавил на каждую итерацию цикла генерацию строки из числа. Очевидно, что в данном случае операция записи в файл занимает больше времени, чем вся остальная логика функции. Но callgrind считает по-другому:
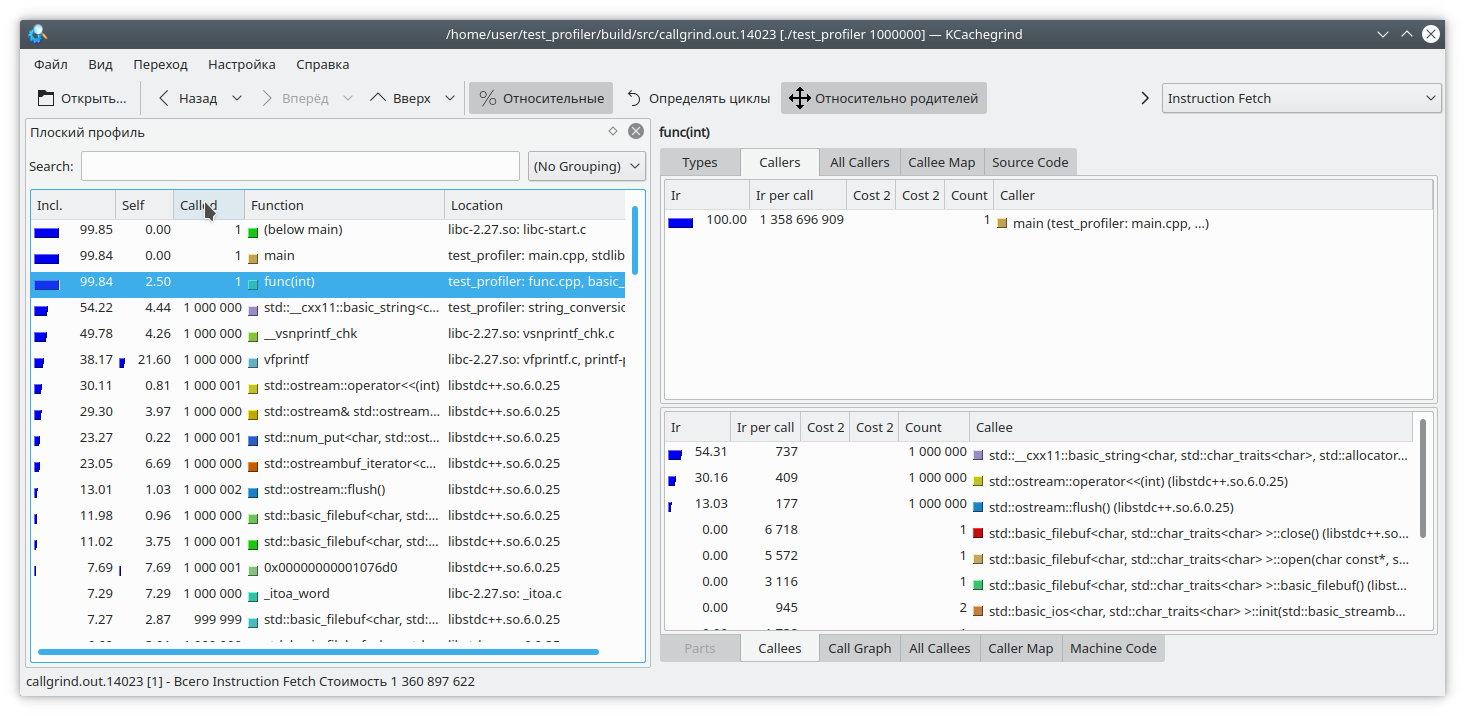
Также стоит учесть, что callgrind может измерять стоимость работы функции, только когда та работает. Функция не работает — значит, и стоимость не растет. Это усложняет отладку программ, которые время от времени входят в блокировку или работают с блокирующей файловой системой/сетью. Давайте проверим:
#include "func.h"

#include <mutex>

static std::mutex mutex;

int funcImpl(int arg) {
    std::lock_guard<std::mutex> lock(mutex);

    int fst = 1;
    int snd = 1;
    for (int i = 0; i < arg; i++) {
        int res = (fst + snd + 1) % 19845689;
        fst = snd;
        snd = res;
    }
    return fst;
}

int func2(int arg){
    return funcImpl(arg);
}

int func(int arg) {
    return funcImpl(arg);
}

int main(int argc, char **argv) {
    if (argc != 2) {
        std::cout << "Incorrect args";
        return -1;
    }

    const int arg = std::atoi(argv[1]);

    auto future = std::async(std::launch::async, &func2, arg);

    std::cout << "result: " << func(arg) << std::endl;
    std::cout << "second result " << future.get() << std::endl;

    return 0;
}
Здесь мы вложили выполнение функции целиком в lock мьютекса, и вызвали эту функцию из двух разных потоков. Результат callgrind-а вполне предсказуем — он не видит проблемы в захвате мьютекса:

Итак, мы рассмотрели некоторые проблемы использования профилировщика callgrind. Давайте перейдем к следующему испытуемому — профилировщику из состава google perftools
google perftools
В отличие от callgrind, профилировщик от google работает по другому принципу.
Вместо того, чтобы анализировать каждую инструкцию исполняемой программы, он приостанавливает выполнение программы через равные промежутки времени и пытается определить, в какой функции в данный момент находится. В результате, это почти не влияет на производительность запущенного приложения. Но у такого подхода есть и свои слабые стороны.
Давайте для начала попробуем провести профилирование первой программы с двумя библиотеками.
Как правило, для запуска профилирования этой утилитой необходимо предзагрузить библиотеку libprofiler.so, выставить частоту сэмплирования и указать файл для сохранения дампа. К сожалению, профайлер требует, чтобы программа завершалась «своим ходом». Принудительное завершение программы приведет к тому, что дамп отчета просто не создастся. Это неудобно при профилировании долгоживущих программ, которые сами по себе не останавливаются, например демонов. Для обхода этого препятствия я создал такой скрипт:
gprof.sh
rnd=$RANDOM

if [ $# -eq 0 ]
  then
    echo "./gprof.sh command args"
    echo "Run with variable N_STOP=true if hand stop required"
    exit
fi

libprofiler=$( dirname "${BASH_SOURCE[0]}" )
arg=$1
nostop=$N_STOP
profileName=callgrind.out.$rnd.g
gperftoolProfile=./gperftool."$rnd".txt
touch $profileName
echo "Profile name $profileName"

if [[ $nostop = "true" ]]
then
    echo "without stop"
    trap 'echo trap && kill -12 $PID && sleep 1 && kill -TERM $PID' TERM INT
else
    trap 'echo trap && kill -TERM $PID' TERM INT
fi

if [[ $nostop = "true" ]]
then
    CPUPROFILESIGNAL=12 CPUPROFILE_FREQUENCY=1000000 CPUPROFILE=$gperftoolProfile LD_PRELOAD=${libprofiler}/libprofiler.so "${@:1}" &
else
    CPUPROFILE_FREQUENCY=1000000 CPUPROFILE=$gperftoolProfile LD_PRELOAD=${libprofiler}/libprofiler.so "${@:1}" &
fi
PID=$!
if [[ $nostop = "true" ]]
then
    sleep 1
    kill -12 $PID
fi
wait $PID
trap - TERM INT
wait $PID
EXIT_STATUS=$?

echo $PWD
${libprofiler}/pprof --callgrind $arg $gperftoolProfile* > $profileName
echo "Profile name $profileName"
rm -f $gperftoolProfile*
Эту утилиту нужно запускать, передавая в качестве параметров имя исполняемого файла и список его параметров. Также, предполагается, что рядом со скриптом лежат необходимые ему файлы libprofiler.so и pprof. В случае, если программа долгоживущая и останавливается путем прерывания выполнения, необходимо установить переменную N_STOP в значение true, например так:
N_STOP=true ./gprof.sh ./test_profiler 10000000000В конце работы скрипт сгенерирует отчет в любимом мною формате callgrind.
Итак, давайте запустим нашу программу под этим профилировщиком
./gprof.sh ./test_profiler 1000000000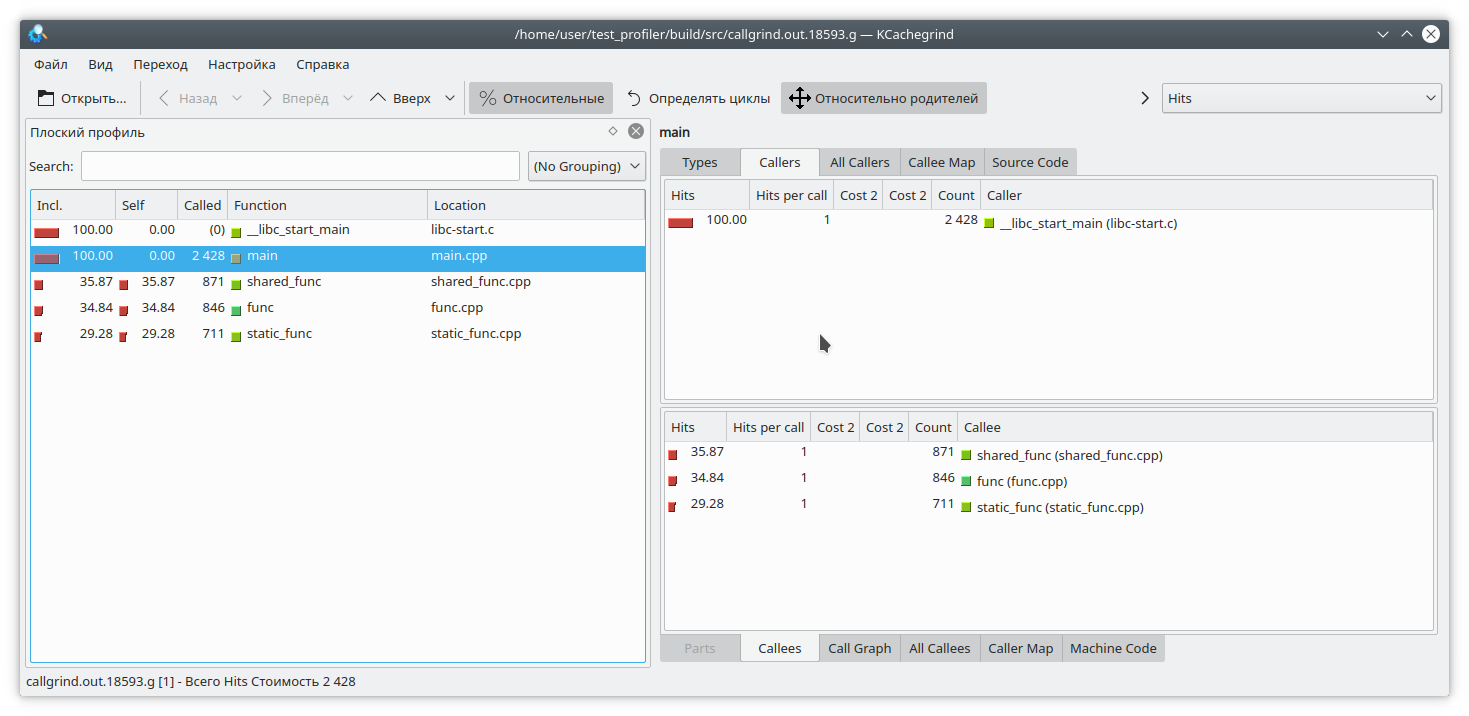
В принципе, все довольно наглядно.
Как я уже сказал, гугловый профилировщик работает, останавливая выполнение программы и вычисляя текущую функцию. Как же он это делает? Делает он это путем раскрутки стека. А что, если в момент раскрутки стека программа сама раскручивала стек? Ну, очевидно, что ничего хорошего при этом не произойдет. Давайте это проверим. Напишем такую функцию:
int runExcept(int res) {
    if (res % 13 == 0) {
        throw std::string("Exception");
    }
    return res;
}

int func(int arg) {
    int fst = 1;
    int snd = 1;
    for (int i = 0; i < arg; i++) {
        int res = (fst + snd + 1) % 19845689;

        try {
            res = runExcept(res);
        } catch (const std::string &e) {
            res = res - 1;
        }

        fst = snd;
        snd = res;
    }
    return fst;
}
И запустим профилирование. Программа довольно быстро зависнет.
Есть и другая проблема, связанная с особенностью работы профайлера. Предположим, мы сумели раскрутить стек, и теперь нам нужно сопоставить адреса с конкретными функциями программы. Это может быть очень нетривиально, так как в C++ довольно большое количество функций инлайнится. Давайте посмотрим на таком примере:
#include "func.h"

static int func1(int arg) {
    std::cout << 1 << std::endl;
    return func(arg);
}

static int func2(int arg) {
    std::cout << 2 << std::endl;
    return func(arg);
}

static int func3(int arg) {
    std::cout << 3 << std::endl;
    if (arg % 2 == 0) {
        return func2(arg);
    } else {
        return func1(arg);
    }
}

int main(int argc, char **argv) {
    if (argc != 2) {
        std::cout << "Incorrect args";
        return -1;
    }

    const int arg = std::atoi(argv[1]);

    int arg2 = func3(arg);
    int arg3 = func(arg);

    std::cout << "result: " <<  arg2 + arg3;
    return 0;
}
Очевидно, что если запустить программу например вот так:
./gprof.sh ./test_profiler 1000000000то функция func1 никогда не вызовется. Но профайлер считает по-другому:
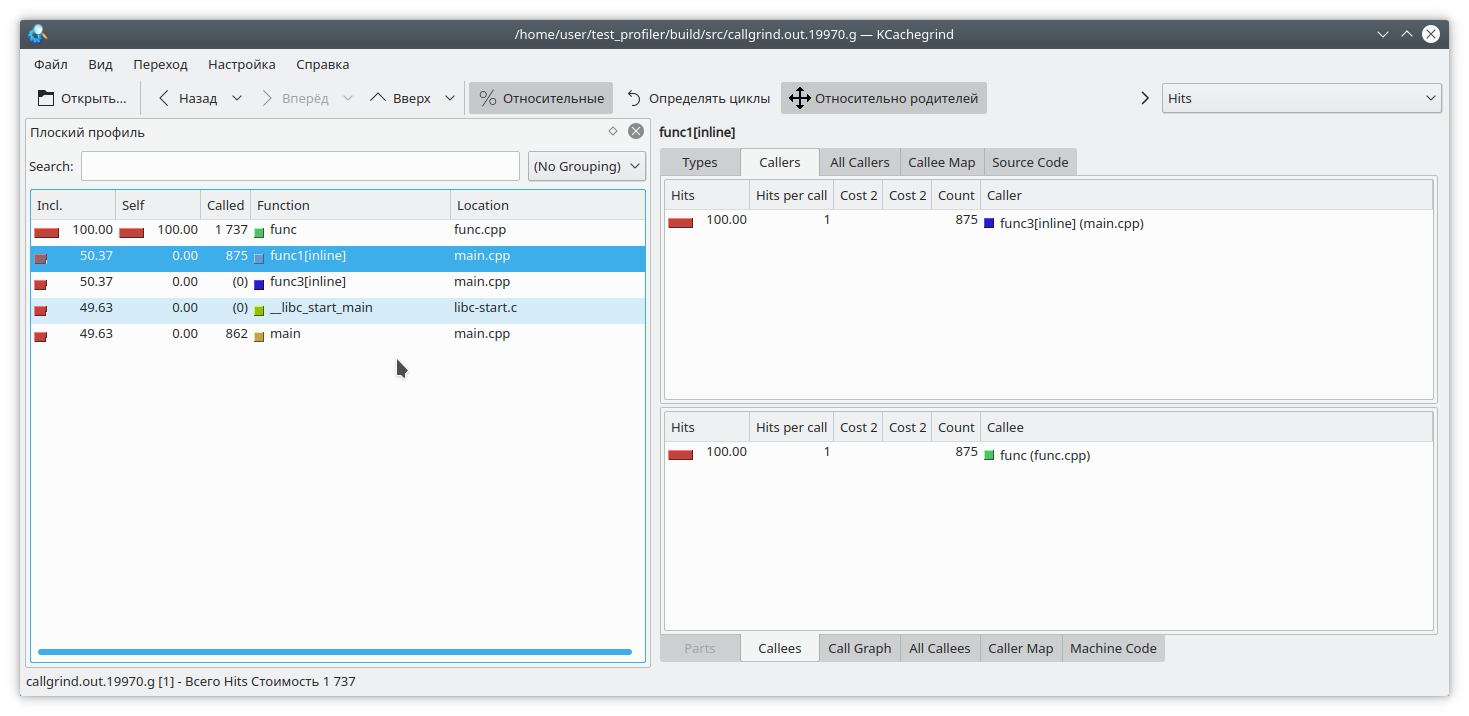
(К слову, valgrind здесь решил скромно промолчать и не уточнять, из какой конкретной функции пришел вызов).
Профилирование памяти
Нередко возникают ситуации, когда память из приложения куда-то «течет». Если это связано с отсутствием очистки ресурсов, то для выявлении проблемы должен помочь Memcheck. Но в современном C++ не так сложно обойтись без ручного управления ресурсами. unique_ptr, shared_ptr, vector, map делают манипулирование «голыми» указателями бесмыссленными.
Тем не менее, и в таких приложениях память бывает что течет. Как это происходит? Довольно просто, как правило это чтото вроде «положил значение в долгоживущий map, а удалить забыл». Давайте попробуем отследить эту ситуацию.
Для этого перепишем нашу тестовую функцию таким образом
#include "func.h"

#include <deque>
#include <string>
#include <map>

static std::deque<std::string> deque;
static std::map<int, std::string> map;

int func(int arg) {
    int fst = 1;
    int snd = 1;
    for (int i = 0; i < arg; i++) {
        int res = (fst + snd + 1) % 19845689;

        fst = snd;
        snd = res;

        deque.emplace_back(std::to_string(res) + " integer");
        map[i] = "integer " + std::to_string(res);
        deque.pop_front();
        if (res % 200 != 0) {
            map.erase(i - 1);
        }
    }
    return fst;
}
Здесь мы на каждой итерации добавляем в мапу некоторые элементы, и совершенно случайно (правда-правда) забываем их оттуда иногда удалить. Также, для отвода глаз мы немного мучаем std::deque.
Отлавливать утечки памяти мы будем двумя инструментами — valgrind massif и google heapdump.
Massif
Запускаем программу такой командой
valgrind --tool=massif ./test_profiler 1000000И видим что-то наподобие
Massif
time=1277949333
mem_heap_B=313518
mem_heap_extra_B=58266
mem_stacks_B=0
heap_tree=detailed
n4: 313518 (heap allocation functions) malloc/new/new[], --alloc-fns, etc.
 n1: 195696 0x109A69: func(int) (new_allocator.h:111)
  n0: 195696 0x10947A: main (main.cpp:18)
 n1: 72704 0x52BA414: ??? (in /usr/lib/x86_64-linux-gnu/libstdc++.so.6.0.25)
  n1: 72704 0x4010731: _dl_init (dl-init.c:72)
   n1: 72704 0x40010C8: ??? (in /lib/x86_64-linux-gnu/ld-2.27.so)
    n1: 72704 0x0: ???
     n1: 72704 0x1FFF0000D1: ???
      n0: 72704 0x1FFF0000E1: ???
 n2: 42966 0x10A7EC: std::__cxx11::basic_string<char, std::char_traits<char>, std::allocator<char> >::_M_mutate(unsigned long, unsigned long, char const*, unsigned long) (new_allocator.h:111)
  n1: 42966 0x10AAD9: std::__cxx11::basic_string<char, std::char_traits<char>, std::allocator<char> >::_M_replace(unsigned long, unsigned long, char const*, unsigned long) (basic_string.tcc:466)
   n1: 42966 0x1099D4: func(int) (basic_string.h:1932)
    n0: 42966 0x10947A: main (main.cpp:18)
  n0: 0 in 2 places, all below massif's threshold (1.00%)
 n0: 2152 in 10 places, all below massif's threshold (1.00%)
Видно, что massif смог обнаружить утечку в функции, но пока не понятно где. Давайте пересоберем программу с флагом -fno-inline и запустим анализ еще раз
massif
time=3160199549
mem_heap_B=345142
mem_heap_extra_B=65986
mem_stacks_B=0
heap_tree=detailed
n4: 345142 (heap allocation functions) malloc/new/new[], --alloc-fns, etc.
 n1: 221616 0x10CDBC: std::_Rb_tree_node<std::pair<int const, std::__cxx11::basic_string<char, std::char_traits<char>, std::allocator<char> > > >* std::_Rb_tree<int, std::pair<int const, std::__cxx11::basic_string<char, std::char_traits<char>, std::allocator<char> > >, std::_Select1st<std::pair<int const, std::__cxx11::basic_string<char, std::char_traits<char>, std::allocator<char> > > >, std::less<int>, std::allocator<std::pair<int const, std::__cxx11::basic_string<char, std::char_traits<char>, std::allocator<char> > > > >::_M_create_node<std::piecewise_construct_t const&, std::tuple<int const&>, std::tuple<> >(std::piecewise_construct_t const&, std::tuple<int const&>&&, std::tuple<>&&) [clone .isra.81] (stl_tree.h:653)
  n1: 221616 0x10CE0C: std::_Rb_tree_iterator<std::pair<int const, std::__cxx11::basic_string<char, std::char_traits<char>, std::allocator<char> > > > std::_Rb_tree<int, std::pair<int const, std::__cxx11::basic_string<char, std::char_traits<char>, std::allocator<char> > >, std::_Select1st<std::pair<int const, std::__cxx11::basic_string<char, std::char_traits<char>, std::allocator<char> > > >, std::less<int>, std::allocator<std::pair<int const, std::__cxx11::basic_string<char, std::char_traits<char>, std::allocator<char> > > > >::_M_emplace_hint_unique<std::piecewise_construct_t const&, std::tuple<int const&>, std::tuple<> >(std::_Rb_tree_const_iterator<std::pair<int const, std::__cxx11::basic_string<char, std::char_traits<char>, std::allocator<char> > > >, std::piecewise_construct_t const&, std::tuple<int const&>&&, std::tuple<>&&) [clone .constprop.87] (stl_tree.h:2414)
   n1: 221616 0x10CF2B: std::map<int, std::__cxx11::basic_string<char, std::char_traits<char>, std::allocator<char> >, std::less<int>, std::allocator<std::pair<int const, std::__cxx11::basic_string<char, std::char_traits<char>, std::allocator<char> > > > >::operator[](int const&) (stl_map.h:499)
    n1: 221616 0x10A7F5: func(int) (func.cpp:20)
     n0: 221616 0x109F8E: main (main.cpp:18)
 n1: 72704 0x52BA414: ??? (in /usr/lib/x86_64-linux-gnu/libstdc++.so.6.0.25)
  n1: 72704 0x4010731: _dl_init (dl-init.c:72)
   n1: 72704 0x40010C8: ??? (in /lib/x86_64-linux-gnu/ld-2.27.so)
    n1: 72704 0x0: ???
     n1: 72704 0x1FFF0000D1: ???
      n0: 72704 0x1FFF0000E1: ???
 n2: 48670 0x10B866: std::__cxx11::basic_string<char, std::char_traits<char>, std::allocator<char> >::_M_mutate(unsigned long, unsigned long, char const*, unsigned long) (basic_string.tcc:317)
  n1: 48639 0x10BB2C: std::__cxx11::basic_string<char, std::char_traits<char>, std::allocator<char> >::_M_replace(unsigned long, unsigned long, char const*, unsigned long) (basic_string.tcc:466)
   n1: 48639 0x10A643: std::__cxx11::basic_string<char, std::char_traits<char>, std::allocator<char> > std::operator+<char, std::char_traits<char>, std::allocator<char> >(char const*, std::__cxx11::basic_string<char, std::char_traits<char>, std::allocator<char> >&&) [clone .constprop.86] (basic_string.h:6018)
    n1: 48639 0x10A7E5: func(int) (func.cpp:20)
     n0: 48639 0x109F8E: main (main.cpp:18)
  n0: 31 in 1 place, below massif's threshold (1.00%)
 n0: 2152 in 10 places, all below massif's threshold (1.00%)
Теперь ясно видно, где утечка — в добавлении элемента map-ы. Massif умеет определять короткоживущие объекты, поэтому манипуляции с std::deque в этом дампе незаметны.
Heapdump
Для работы google heapdump необходимо прилинковать или предзагрузить библиотеку tcmalloc. Эта библиотека подменяет стандартные функции выделения памяти malloc, free,… Также она умеет собирать информацию об использовании этих функций, чем мы и воспользуемся при анализе программы.
Так как этот метод работает очень неторопливо (даже по сравнению с massif-ом), рекомендую сразу отключить при компиляции встраивание функций опцией -fno-inline. Итак, пересобираем наше приложение и запускаем с командой
HEAPPROFILESIGNAL=23 HEAPPROFILE=./heap ./test_profiler 100000000Здесь предполагается, что библиотека tcmalloc прилинкована к нашему приложению.
Теперь, выжидаем некоторое время, необходимое для образования заметной утечки, и посылаем нашему процессу сигнал 23
kill -23 <pid>В результате появляется файл с именем heap.0001.heap, который мы конвертируем в callgrind формат командой
pprof ./test_profiler "./heap.0001.heap" --inuse_space --callgrind > callgrind.out.4Обратите также внимание на опции pprof-а. Можно выбирать из опций inuse_space, inuse_objects, alloc_space, alloc_objects, которые показывают находящиеся в использование пространство или объекты, или выделенное за все время работы программы пространство и объекты соответственно. Нас интересует опция inuse_space, которая показывает используемое в настоящее время пространство памяти.
Открываем наш любимый kCacheGrind и видим
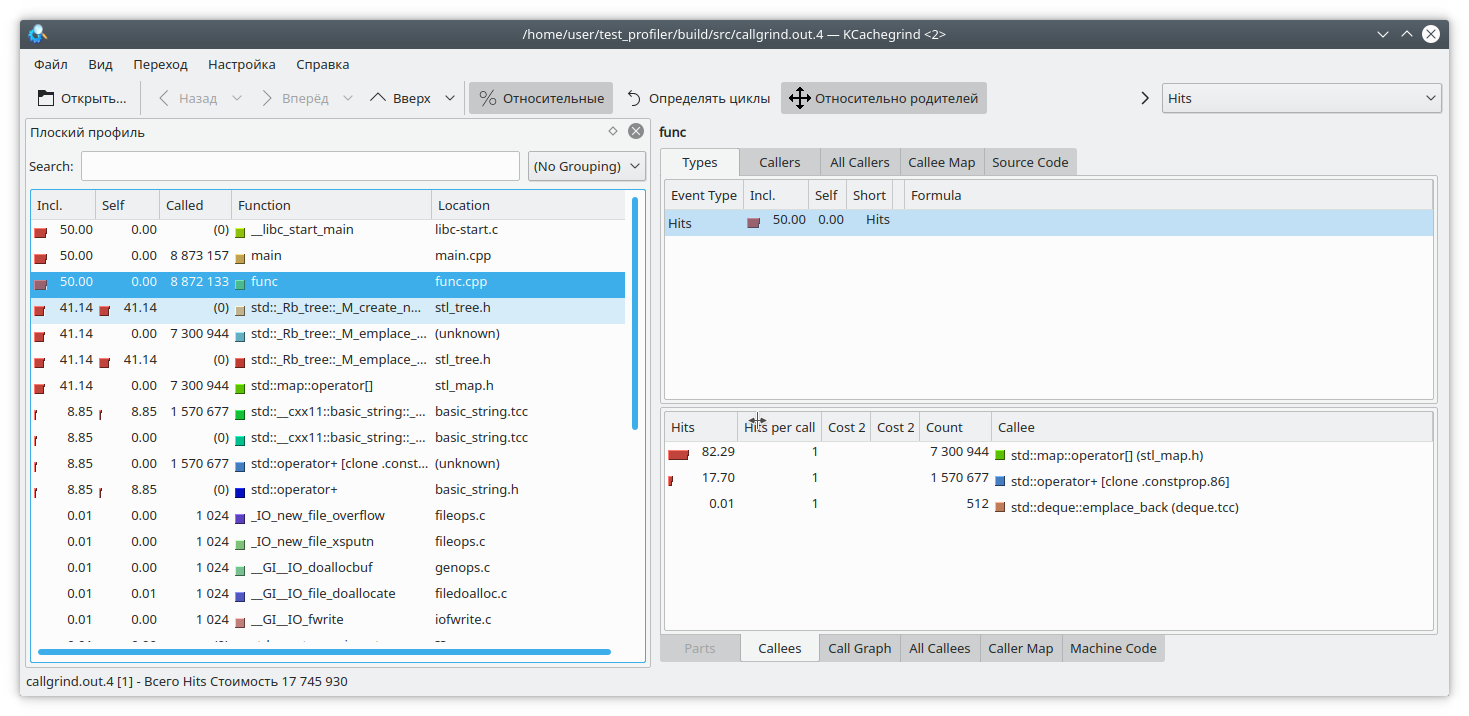
std::map «выел» слишком много памяти. Наверное утечка в нем.
Выводы
Профилирование на C++ — очень непростая задача. Здесь нам придется бороться с инлайнингом функций, неподдерживаемыми инструкциями, некорректными результатами и т.д. Не всегда можно доверять результатам работы профилировщика.
Кроме предложенных выше функций, есть и другие инструменты, предназначенные для профилирования — perf, intel VTune и другие. Но и они проявляют некоторые из указанных недочетов. Поэтому не стоит забывать и о «дедушкином» способе профилирования путем замера времени выполнения функций и выводе его в лог.
Также, если у вас есть интересные приемы профилирования кода, прошу выкладывать их в комментариях
Contents:
- What is a Memory Profiler?
- Using Memory Profile to Find Memory Leaks
- Conclusion
Memory management is a vital aspect of software engineering that most developers forget or ignore because of its high complexity. The variety of so many tools impede the right choice for the majority of developers. In this tutorial, you will learn how to use a memory profiler for Visual Studio to find memory leaks and fix them.
What is a Memory Profiler?
In computer programming, a profiler is an application to analyze programs at runtime. Memory Profiler is a tool to measure memory usage, capture allocated resources along with comprehensive information such as their size, detailed call stacks, and types.
Memory profiler helps you find memory leaks and unexpectedly large allocations in a program. A graph for analyzing memory usage is displayed in real-time to locate memory usage peaks. The analysis is carried out to identify whether memory use is typical or excessive.
Visual Studio is a favorite IDE for thousands of millions of developers worldwide, but unfortunately, its capability in memory profiling is minimal. Another standard tool, WinDBG, is trendy among experienced developers, but it takes significant time to learn. Also, a developer needs to leave Visual Studio, as WinDBG is a separate application.
Various debugging tools’ quality of information is not always sufficient to determine if some specific memory leak is happening in your program. Some of them collect data about heap allocations only; others provide incomplete call stacks.
You need a tool that provides results immediately, allows you to profile memory without leaving Visual Studio, and doesn’t require additional steps to enable profiling for a particular application.
Deleaker is a memory profiler that integrates with Visual Studio. Unlike similar tools, Deleaker doesn’t require modifying source code or system registry. Additionally, Deleaker finds leaks of handles, GDI, and USER Objects.
Using Memory Profile to Find Memory Leaks
First of all, download and install Deleaker. Then run Visual Studio and look if Deleaker is enabled or not. To enable or disable Deleaker, click on Extensions – Deleaker – Enable Deleaker. When you don’t need to find memory leaks, just disable Deleaker, and it will not bother you. When enabled, Deleaker cooperates with the standard debugger, gathering information about loaded and unloaded modules to get debugging information for each module and set required hooks to save all allocations.
If you want to know how many bytes each allocation has, take a snapshot. Snapshot is a list of allocations that are not freed at some time point. When you click on Take Snapshot in Deleaker, it stops execution and stores information about each allocation to a database, including call stacks. Once the snapshot is ready, the process continues execution.
Let’s look at how the memory profiler works. We will create a small application that doesn’t allocate memory directly but utilizes C++ smart pointers. However, it still has memory leaks because of cyclic references, so the reference counter of each smart pointer never becomes zero.
Imagine, you need to parse a file path and store directory names and the file name in some tree:
class Node : public std::enable_shared_from_this<Node>
{
public:
    Node() : Node("", nullptr) {}

    Node(const std::string& name, std::shared_ptr<Node> parent) :
        _name(name), _parent(parent)
    {
    }

    std::shared_ptr<Node> Add(const std::string& name)
    {
        auto node = std::make_shared<Node>(name, shared_from_this());
        _nodes.insert(std::make_pair(name, node));
        return node;
    }

private:
    std::string const _name;
    std::map<std::string, std::shared_ptr<Node>> _nodes;
    std::shared_ptr<Node> const _parent;
};

std::shared_ptr<Node> Parse(const std::string& path)
{
    auto root = std::make_shared<Node>();
    auto node = root;

    std::string s = path;

    size_t pos = 0;
    while (std::string::npos != (pos = s.find('\\')))
    {
        node = node->Add(s.substr(0, pos));
        s.erase(0, pos + 1);
    }

    return root;
}

int main()
{
    auto tree = Parse("C:\\Windows\\System32\\kernel32.dll");
}
The code looks good: no raw pointer allocations. Build the project, enable Deleaker and start debugging. The application has closed, and Deleaker has created a report. There are some leaks:
The call stacks point to allocations of Node instances. The reason is a child node keeps a reference to its parent node. The obvious solution is to use a weak smart pointer instead, provided by std::weak_ptr. Modify the code as shown below, changing the type of Node::_parent:
class Node : public std::enable_shared_from_this<Node>
{
...
    std::weak_ptr<Node> const _parent;
};
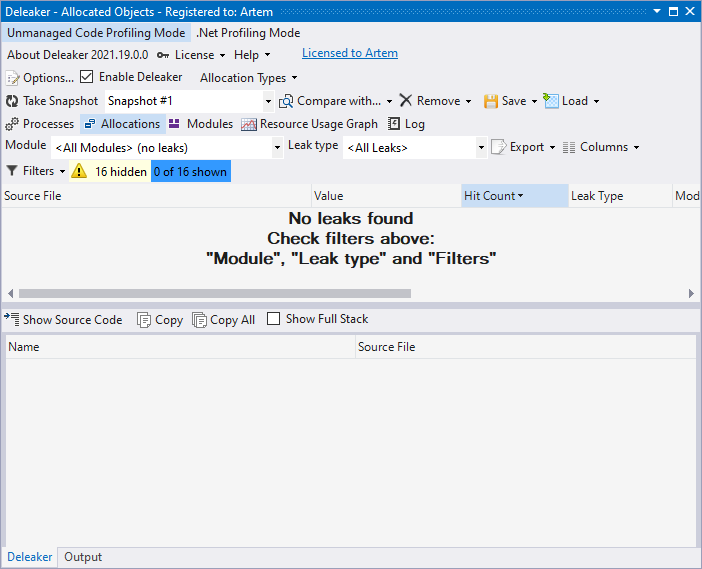
Rebuild the project and run. The snapshot is empty. No leaks found:
Conclusion
Following the C++ best practice is a must for developers, but memory leaks still happen. Cyclic references are a widespread scenario: objects just keep a reference to each other; that is why they are always kept in memory. In this case, weak references to the rescue.
A memory profiler takes snapshots so developers can explore live allocations. Call stacks give insights into where memory is allocated.
Visual Studio memory profilers, like Deleaker, integrate with the IDE to assist developers in profile memory usage and leak fixing.
Free Download Puredev MemPro 1.6.8.0 Full Version — Latest Offline Installer — C++ memory profiler able to handle very large data sets .
Free Download Puredev MemPro full version standalone offline installer for Windows; it is a C++ memory profiler able to handle massive data sets.
You can also FREE download MicroSys A1 Website Search Engine
Overview of Puredev MemPro
This program is a C++ memory profiler. It runs on Windows platforms but can connect to and profile applications on almost any platform. It stands out from other C++ memory profilers’ ability to handle massive data sets.
Integrate it into your codebase in minutes — add MemPro.cpp/h into your code, and you will be able to connect to your application.
Moreover, this profiler can handle massive data sets. Profiles of trillions of allocations are not uncommon. It is also perfect for real-time profiling applications such as games because of its minimal overhead.
Features of Puredev MemPro
- Full memory breakdown of your application
- Multiple views of the data
- Easily find and fix memory leaks
- Subtract one snapshot from another
- Rewind memory
- Virtual memory layout visualization
- Visualize memory fragmentation
- Profile applications of any size quickly and efficiently
Technical Details and System Requirements
- Supported OS: Windows 11, Windows 10, Windows 8.1, Windows 7
- RAM (Memory): 2 GB RAM (4 GB recommended)
- Free Hard Disk Space: 200 MB or more
Previous version
File Name:Puredev MemPro 1.6.3.0 (x64)
Version:1.6.3.0