
If you are using the Inspector’s web app version, this step is, of course, not required. But if
you wish to use the Inspector desktop app, it needs to be installed first.
The app can be downloaded from the Inspector’s GitHub repository.
Different file formats are provided for each supported platform.
Windows
For Windows it is recommended to download the .exe installer file, as it supports checking for updates.
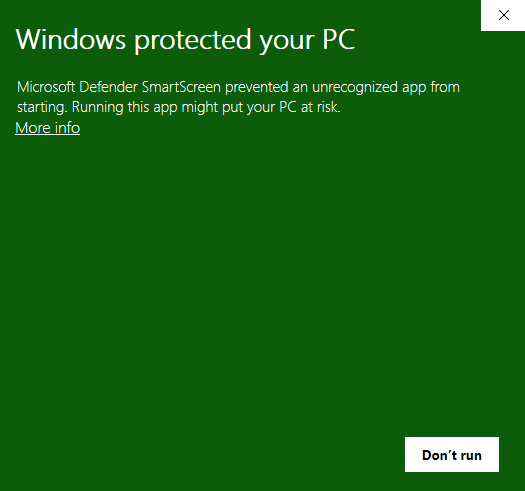
Since the app is currently not signed, Windows will show a security warning to prevent you from
opening the installer file. This can be bypassed with sufficient user permissions.
- Right-click on the installer file and click Properties — a new window should open.
- Near the bottom of the window, there will be an Unblock checkbox — check it.
- Click OK.
- You should now be able to open the installer without issues.
Alternatively, you can also bypass this after having opened the installer:
- Upon opening the installer, the following warning will likely be shown.

- Click More info — a new button Run anyway should appear at the bottom.
- Click Run anyway — the installer window should open.
After following the installer steps, the Inspector app should be installed, and you should be able
to open it without any warnings.
macOS
For macOS it is recommended to download the .dmg file, as it supports checking for updates.
Opening the file will open a simple window, showing icons for the Inspector and the Applications folder.
Drag-and-drop the Inspector icon over the Applications icon to extract the app.
Since the app is currently not notarized,
macOS will show various security warnings to prevent you from opening the app for the first time.
The steps to handle these warnings are described below. Note that you will only need to go through
these steps once — subsequent attempts to open the app should work fine.
There are two ways to work around these warnings: using the macOS user interface, or using the
command line. The user interface flows will differ depending on your macOS version, while the
command line approach works for all macOS versions.
Command Line
Simply open your Terminal app and run the following command:
xattr -cr "/Applications/Appium Inspector.app"
You should now be able to open the app with no warnings.
UI — macOS Sequoia or later
With macOS Sequoia, Apple has tightened their security for installing non-notarized apps, so the
required steps to allow opening the app have become more complex.
Note
If your Mac has an Apple chip, you can skip these steps by installing Appium Inspector v2024.9.1
(which should not show any warnings), then using the update checker
to upgrade to the most recent version.
- Upon opening the app, the following warning will be shown. Click Done.
- Open macOS Settings -> Privacy & Security, then scroll down to the Security section. You should
see the info text «Appium Inspector» was blocked to protect your Mac. - Click Open Anyway.
- A prompt should appear — click Open Anyway again.
- A prompt should appear, requiring you to confirm the action using administrator user credentials.
- After confirming the action, the app should open.
UI — macOS Sonoma or earlier
- Upon opening the app, the following warning will be shown. Click OK.
- Open Finder -> Applications and find Appium Inspector.
- Control+Click/click with two fingers on Appium Inspector and click Open.
- A prompt should appear — click Open again.
- After accepting the prompt, the app should open.
Linux
For Linux it is recommended to download the .AppImage file, as it supports checking for updates.
In order to open the file, its executable flag needs to be set first:
chmod a+x Appium-Inspector-<version>-linux-<arch>.AppImage
Afterwards, the app can be opened through the command line:
./Appium-Inspector-<version>-linux-<arch>.AppImage
2025.3.1
Highlights
- Integration with TV Labs and Testcribe cloud providers
- Upgrade embedded Electron version to the latest v35.0.2
- Appium Inspector is now also published as an Appium plugin — check the README for details!
What’s Changed
🚀 New Features
- feat: enable appium-inspector as an appium plugin by @KazuCocoa and @saikrishna321 in #1878, #1883, #1890, #1990
- feat: add TV Labs cloud provider by @regan-karlewicz in #1906
- feat: add support for Appium 3 session retrieval by @eglitise in #1927
- feat: Isolate vendor logic for session creation by @mykola-mokhnach in #1966
- feat: add Testcribe as a cloud provider by @testcribe in #1965
🛠 Fixes
- fix: adjust java client tests from recorder by @SrinivasanTarget in #1884
- fix: ensure selected client framework dropdown values are in sync by @eglitise in #1972
🌐 Localization
- chore: Update translations by @github-actions in #1872, #1881, #1913, #1941, #1958, #1980
🔍 Other Changes
- ⚠ Windows desktop app: the menu bar is now hidden in fullscreen mode (this is due to the upgrade to Electron v34)
- chore: add base for browser build by @KazuCocoa in #1849
- ci: run lint job for all changes by @eglitise in #1918
- ci: add workflow to validate PR title by @eglitise in #1919
- chore: refactor session detail storage & retrieval by @eglitise in #1942
- chore: update LICENSE to use full AL2.0 text by @eglitise in #1962
- chore: refactor lib directory by @eglitise in #1973
- chore: refactor vendormap for clarity by @eglitise in #1992
New Contributors
- @SrinivasanTarget made their first contribution in #1884
- @regan-karlewicz made their first contribution in #1906
- @testcribe made their first contribution in #1965
Full Changelog: v2024.12.1…v2025.3.1
2024.12.1
Highlights
Maintenance release with a fix for an issue introduced in 2024.9.1.
- Fix error when app source contains the Unicode replacement character (
�) (issue #1729) - Upgrade embedded Electron version from v31.6.0 to the latest v33.2.1
What’s Changed
📦 Platform Support
- ⚠ macOS: the minimum supported version is now macOS 11
🛠 Fixes
- fix error when app source contains the Unicode replacement character in #1839
- fix: add missing standard W3C caps by @eglitise in #1841
🌐 Localization
- chore: Update translations by @github-actions in #1798
- chore: Update translations by @github-actions in #1813
- chore: Update translations by @github-actions in #1830
🔍 Other Changes
- ci: add initial creating package GHA by @KazuCocoa in #1784
- ci: GHA to create packages for electron by @KazuCocoa in #1785
Full Changelog: v2024.9.1…v2024.12.1
2024.9.1
Highlights
- Selenium Grid support
- Session creation and attaching to existing sessions are both supported
- New button to save element screenshot
- Upgrade embedded Electron version from v13.6.9 to v31.6.0
- Many security fixes and performance improvements
What’s Changed
📦 Platform Support
- ⚠ macOS: drop support for macOS < 10.15
- ⚠ Windows: drop support for Windows < 10
🚀 New Features
- feat: support creating sessions for Selenium Grid devices by @eglitise in #1632
- feat: add button to save element screenshot by @eglitise in #1676
- feat: support attaching to Selenium Grid sessions by @eglitise in #1690
🛠 Fixes
- fix: improve flow when importing session file by @eglitise in #1651
- fix: fix support for
Attach to Sessionfor LambdaTest server by @Delta456 in #1656 - fix: resolve some screenshot Coordinates Mode issues by @eglitise in #1695
- fix: adjust calculation of element highlighter positions by @eglitise in #1698
- fix: prevent Coordinates Mode from intercepting modals by @eglitise in #1699
📖 Documentation
- docs: add note about CORS in dev mode by @eglitise in #1633
🌐 Localization
- chore: Update translations by @github-actions in #1639
- chore: Update translations by @github-actions in #1666
🔍 Other Changes
- chore: upgrade Electron from v13.6.9 to v31.4.0 by @eglitise in #1659
- chore: Electron-related refactoring/dependency changes by @eglitise in #1634, #1646, #1655, #1663, #1664, #1667, #1668 and #1669
- chore: migrate to ESLint flat config and adjust rules by @eglitise in #1673 and #1675
New Contributors
- @Delta456 made their first contribution in #1656
Full Changelog: v2024.8.2…v2024.9.1
2024.8.2
Highlights
- Gestures can now be imported and exported
- Saved gestures are now shown over the screenshot on hover, not click
- New infobox when selecting an element at
snapshotMaxDepth - Upon opening the attach to session tab, session discovery is now run automatically
- The filepath input type in the capability fields has been removed (the file picker cannot work in the browser version)
What’s Changed
🚀 New Features
- feat: add infobox for elements at
snapshotMaxDepthby @eglitise in #1596 - feat: replace native confirmation popups with
antdpopconfirms by @eglitise in #1611- These are used when deleting a saved capability set or gesture
- feat: improve UX for attaching to existing session by @eglitise in #1607
- Automatically retrieve sessions upon opening the Attach to Session tab
- List discovered sessions in reverse order (newest to oldest)
- Add more details in session description
- feat: add support for export/import gestures in json format by @sudharsan-selvaraj in #1491
- Multiple gesture files can be uploaded at the same time
- Detailed error messages are shown if the uploaded gesture files are invalid
- feat: add or update tooltips to various buttons by @eglitise in #1597, #1607, #1616, #1620, #1627
- feat: improve presentation of saved gestures table by @eglitise in #1623
- Table height is now limited by the Inspector window height — the new gesture button no longer needs to be scrolled into view if the user has many gestures
- Visualising a gesture over the screenshot now only requires hovering instead of clicking
🛠 Fixes
- fix: update WDIO generated code for tap/swipe actions by @eglitise in #1541
- fix: adjust syntax for .NET codegen by @eglitise in #1540
- fix: disable Inspector tabs until screenshot has loaded by @eglitise in #1545
- fix: do not generate code for element searches if recording is turned off by @eglitise in #1586
- fix: retrieve
disableIdLocatorAutocompletionfrom settings instead of capabilities by @eglitise in #1595 - fix: open most recent server type tab on app launch by @eglitise in #1613
- fix: do not add prefix to
webSocketUrlcapability by @eglitise in #1617 - fix: prevent deletion of default pointer in gesture by @eglitise in #1621
- fix: adjust saved session JSON height to fit in container by @eglitise in #1625
📖 Documentation
- docs: tune gesture builder docs by @eglitise in #1629
🌐 Localization
- chore: Update translations by @github-actions in #1535
- chore: Update translations by @github-actions in #1599
- chore: Update translations by @github-actions in #1612
- chore: Update translations by @github-actions in #1628
🔍 Other Changes
- chore: remove filepath input type in capability builder by @eglitise in #1531
- chore: fix
i18nextwarnings by @eglitise in #1574, #1630 - chore: migrate from Parcel v1 to Vite by @eglitise in #1558
- As a side effect, the app now opens notably faster!
- Also switch from
mocha/chaitovitest - Refer to #1453 for all the refactoring changes made to achieve this
- chore: store session settings in Redux by @eglitise in #1592
Full Changelog: v2024.6.1…v2024.8.2
2024.6.1
What’s Changed
🚀 New Features
- feat: add locator details to find element results by @sudharsan-selvaraj in #1485
- This information is only shown if no results are found
🛠 Fixes
- fix: fix updater by @eglitise in #1407
- Currently only manual update checking is supported. For more details, check the documentation.
- fix: replace newlines in element properties with \n by @miwtoo in #1442
- fix: do not add appium: for undefined capability keys by @KazuCocoa in #1480
- fix: add validation for duplicate capability set name by @sudharsan-selvaraj in #1483
- This does not affect already existing capability sets with duplicate names
🌐 Localization
- chore: Update translations by @github-actions in #1410
- chore: Update translations by @github-actions in #1428
- chore: Update translations by @github-actions in #1439
- chore: Update translations by @github-actions in #1449
- chore: Update translations by @github-actions in #1463
- chore: Update translations by @github-actions in #1495
🔍 Other Changes
- chore: use .jsx and .module.css file extensions where appropriate by @eglitise in #1444
- chore: refactor by @eglitise in #1447
New Contributors
- @miwtoo made their first contribution in #1442
Full Changelog: v2024.3.4…v2024.6.1
2024.3.4
What’s Changed
📦 Platform Support
- ℹmacOS: replaced universal builds with separate
x64andarm64builds - ⚠Windows: removed
ia32builds (please create an issue if you would like these to be re-added) - 🎉Windows: added
arm64builds - 🎉Linux: added
tar.gzformat - 🎉Linux: added
arm64builds
🚀 New Features
- feat: add suggested selector for UiAutomator strategy by @eglitise in #1394
🛠 Fixes
- fix: add pcloudy:options for setting the ‘source’, username and apikey capability for pCloudy to comply with W3C by @shibupanda in #1388
- fix: generate suggested locators upon selecting element instead of upon retrieving source by @eglitise in #1389
- Depending on your app source, this may speed up the source retrieval by anywhere from 100ms to several seconds or even more! ⚡
- fix: show spinner for element ID property until it is retrieved by @eglitise in #1390
- fix: use horizontal scrolling for selected element table values by @eglitise in #1394
- fix: fallback to default server tab when unselecting current provider by @eglitise in #1396
- fix: rename TestingBot key and secret to username and accessKey by @jochen-testingbot in #1401
🌐 Localization
- chore: Update translations by @github-actions in #1393
🔍 Other Changes
- ci: update electron-builder and Azure pipeline configurations by @eglitise in #1404
New Contributors
- @shibupanda made their first contribution in #1388
- @jochen-testingbot made their first contribution in #1401
Full Changelog: v2024.3.1…v2024.3.4
2024.3.1
What’s Changed
🛠 Fixes
- fix: correctly account for position and scroll values of webviews by @jlipps in #1378
🌐 Localization
- chore: Update translations by @github-actions in #1357
Full Changelog: v2024.2.2…v2024.3.1
2024.2.2
What’s Changed
🛠 Fixes
- fix: resolve ‘t’ error on saved caps tab by @eglitise in #1345
- This affected users with one or more unnamed saved capability sets
Full Changelog: v2024.2.1…v2024.2.2
2024.2.1
What’s Changed
🚀 New Features
- feat: update menu bar by @eglitise in #1338
- add buttons for Delete, Zoom (macOS only), Zoom In, Zoom Out, Reset Zoom, link to Appium Discuss
- remove Save button (same as Save As)
- show the Edit menu for non-macOS
🛠 Fixes
- fix: resolve issue with Start Session sometimes needing a second click by @orionlize in #1299
- fix: improve scaling of screenshot width for larger window sizes by @eglitise in #1306
- fix: reduce getSession endpoint calls in hybrid mode by @KazuCocoa in #1330
- fix: update menu bar immediately after changing language by @eglitise in #1338
📖 Documentation
- docs: add MkDocs documentation by @eglitise in #1312
- Check out the documentation at https://appium.github.io/appium-inspector/
- docs: update Mobitru docs link by @vliubezny in #1283
- docs: update README by @eglitise in #1322
- docs: address possible removal in cloud providers by @KazuCocoa in #1324
🌐 Localization
- feat: enable Arabic, French, Turkish, Traditional Chinese translations by @eglitise in #1323
- fix: add remaining translation keys by @eglitise in #1319
- fix: rename Desired Capabilities to Capability Builder by @eglitise in #1332
- chore: Update translations by @github-actions in #1271
- chore: Update translations by @github-actions in #1315
- chore: Update translations by @github-actions in #1340
New Contributors
- @orionlize made their first contribution in #1299
Full Changelog: v2023.12.2…v2024.2.1
2023.12.2
What’s Changed
- fix: adjust highlighter positions again by @eglitise in #1259
- this problem affected Android devices which had one of the screen dimensions below 1000px, and the other above 1000px
- fix: undefined value reference by @KazuCocoa in #1208
- this problem affected the process of attaching to an existing session
- style: remove custom anticon :hover style by @ath0mas in #1224
New Contributors
- @ath0mas made their first contribution in #1223
Full Changelog: v2023.11.1…v2023.12.2
Welcome to this new article in our “Appium Tutorial for Beginners” series. In this article, you will see the detailed steps on how you can download and install Appium Inspector for Windows.
Appium Inspector is basically an Appium client with its own user interface. It is the GUI tool using which you can inspect elements in the mobile app that you are testing.
Let us first get to the steps using which you can download and install Appium Inspector. Later in our Appium tutorial series, we will have more detailed articles on how to use this tool
Follow the steps given below to download the latest version of Appium Inspector –
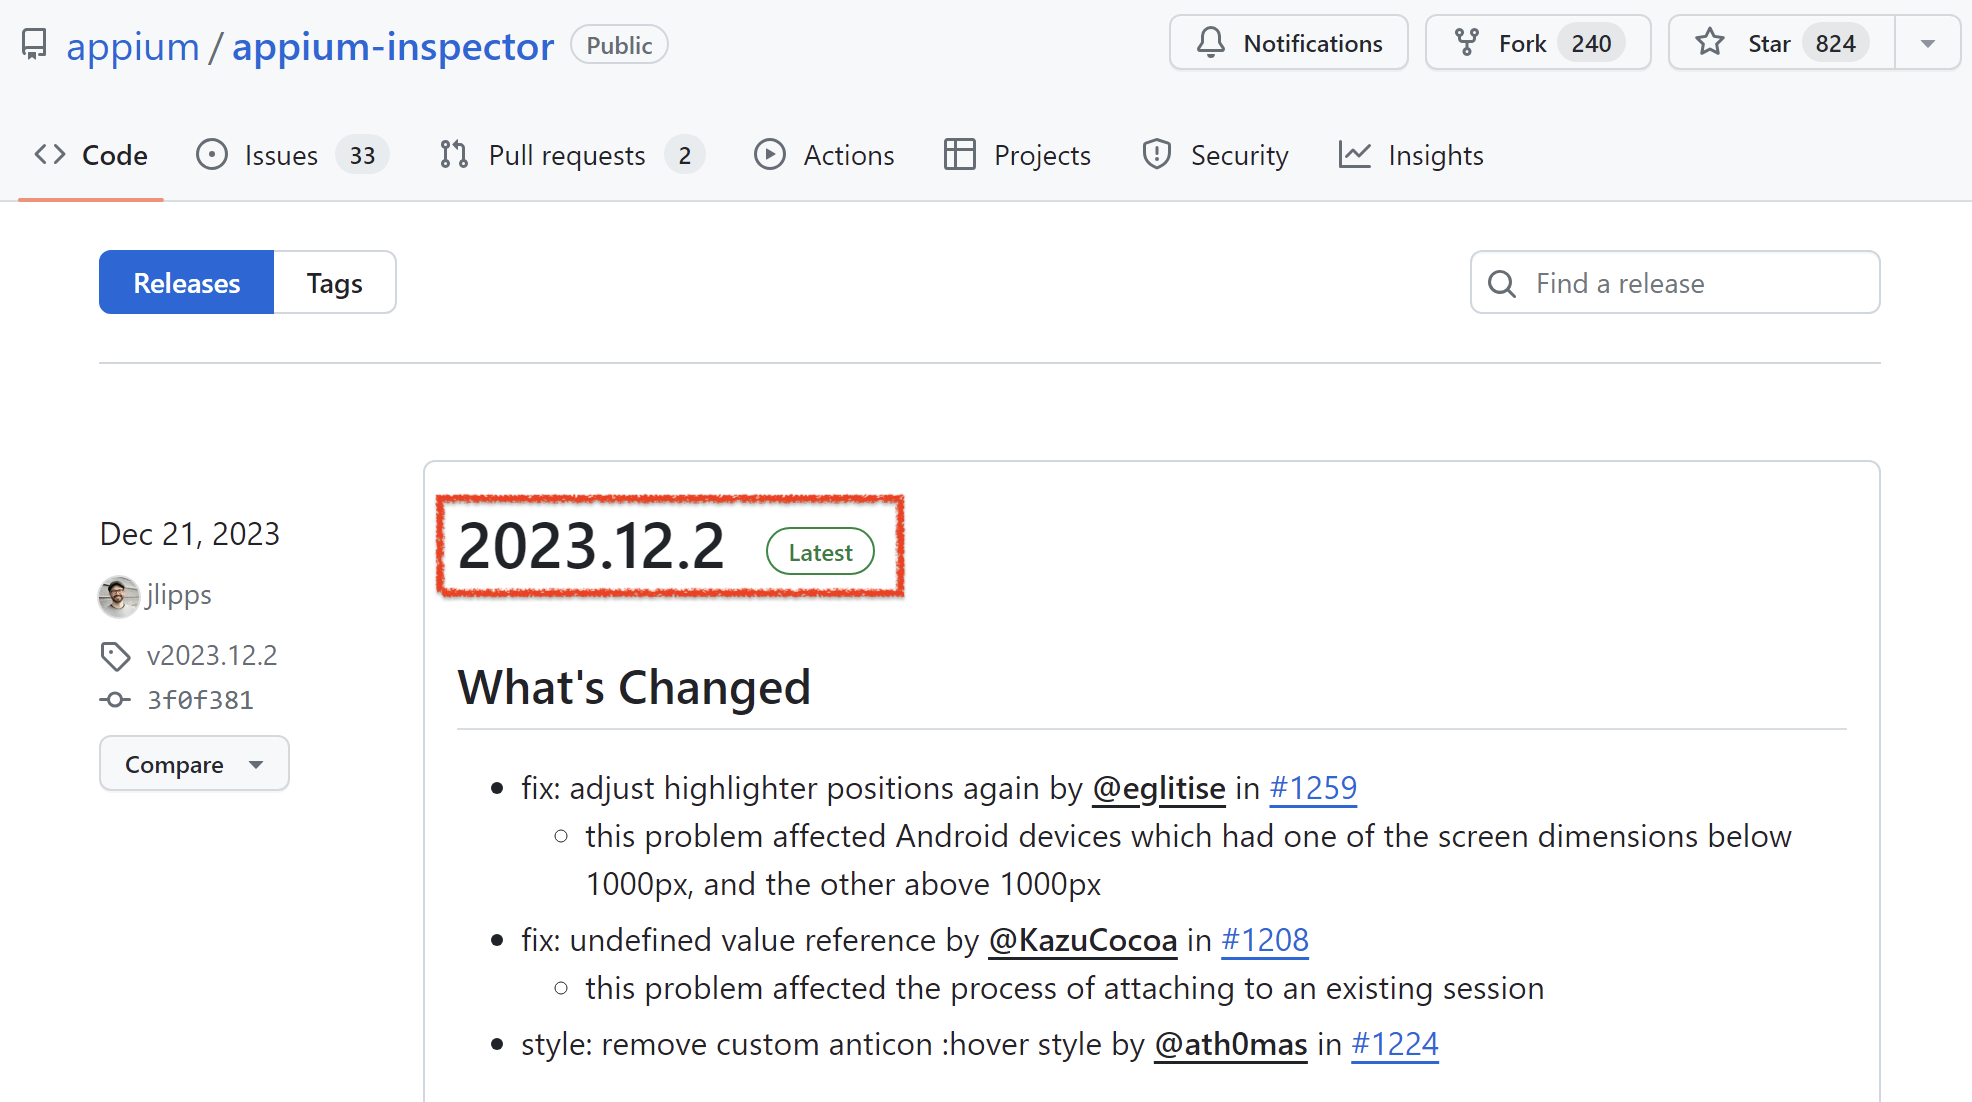
1. Open Github Appium Inspector Releases page – https://github.com/appium/appium-inspector/releases
On this Github page, you will be able to see the latest release details (as on 29th Jan 2024, the latest release is 2023.12.2)
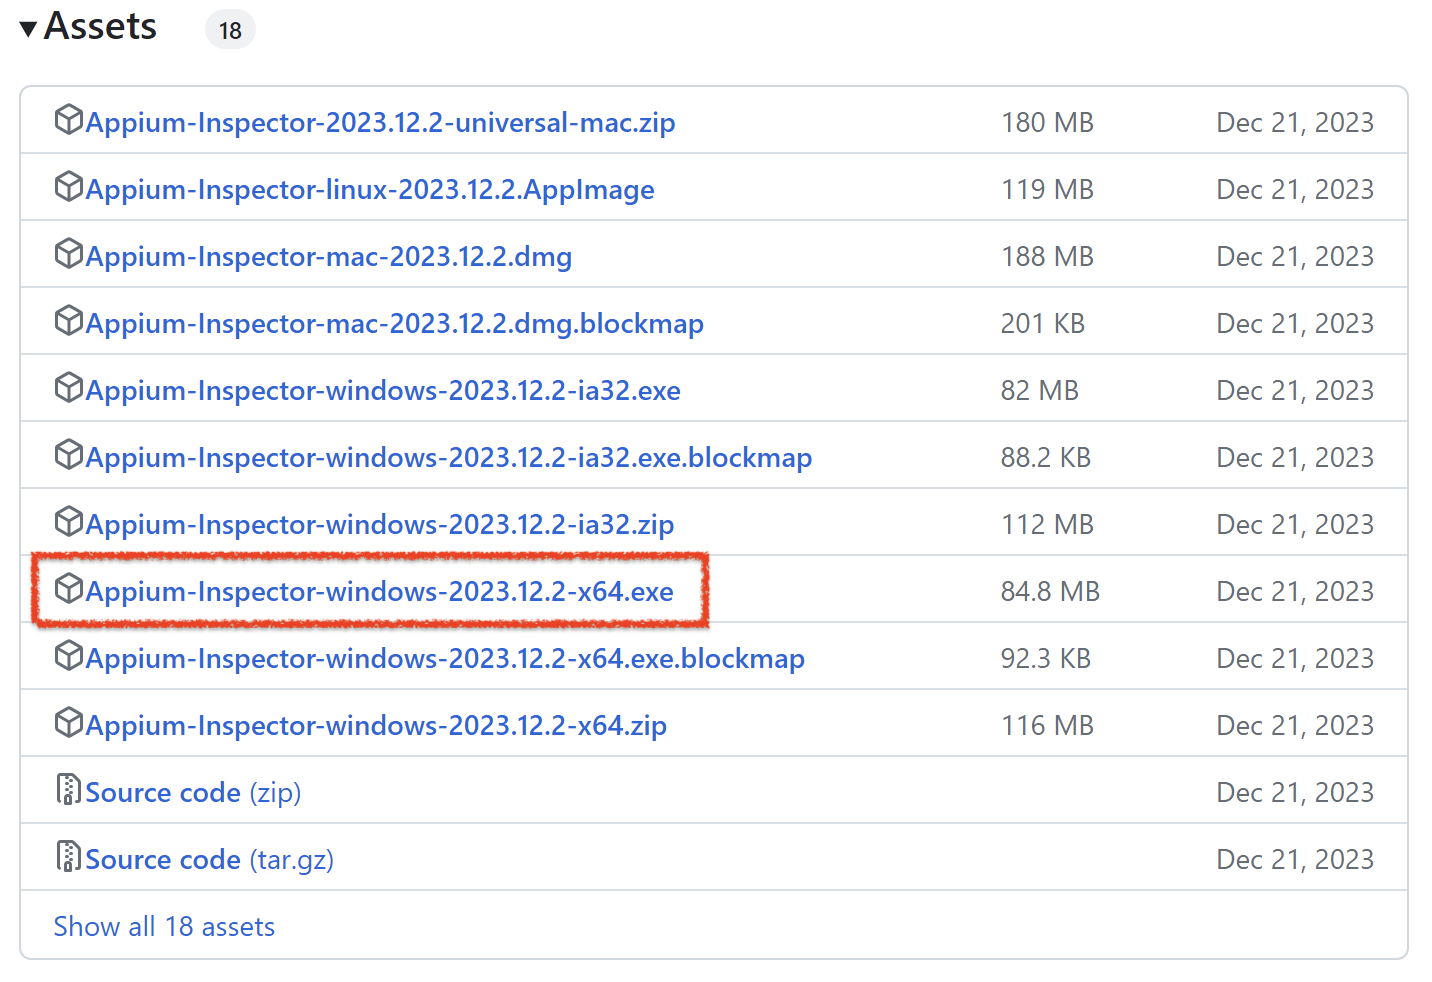
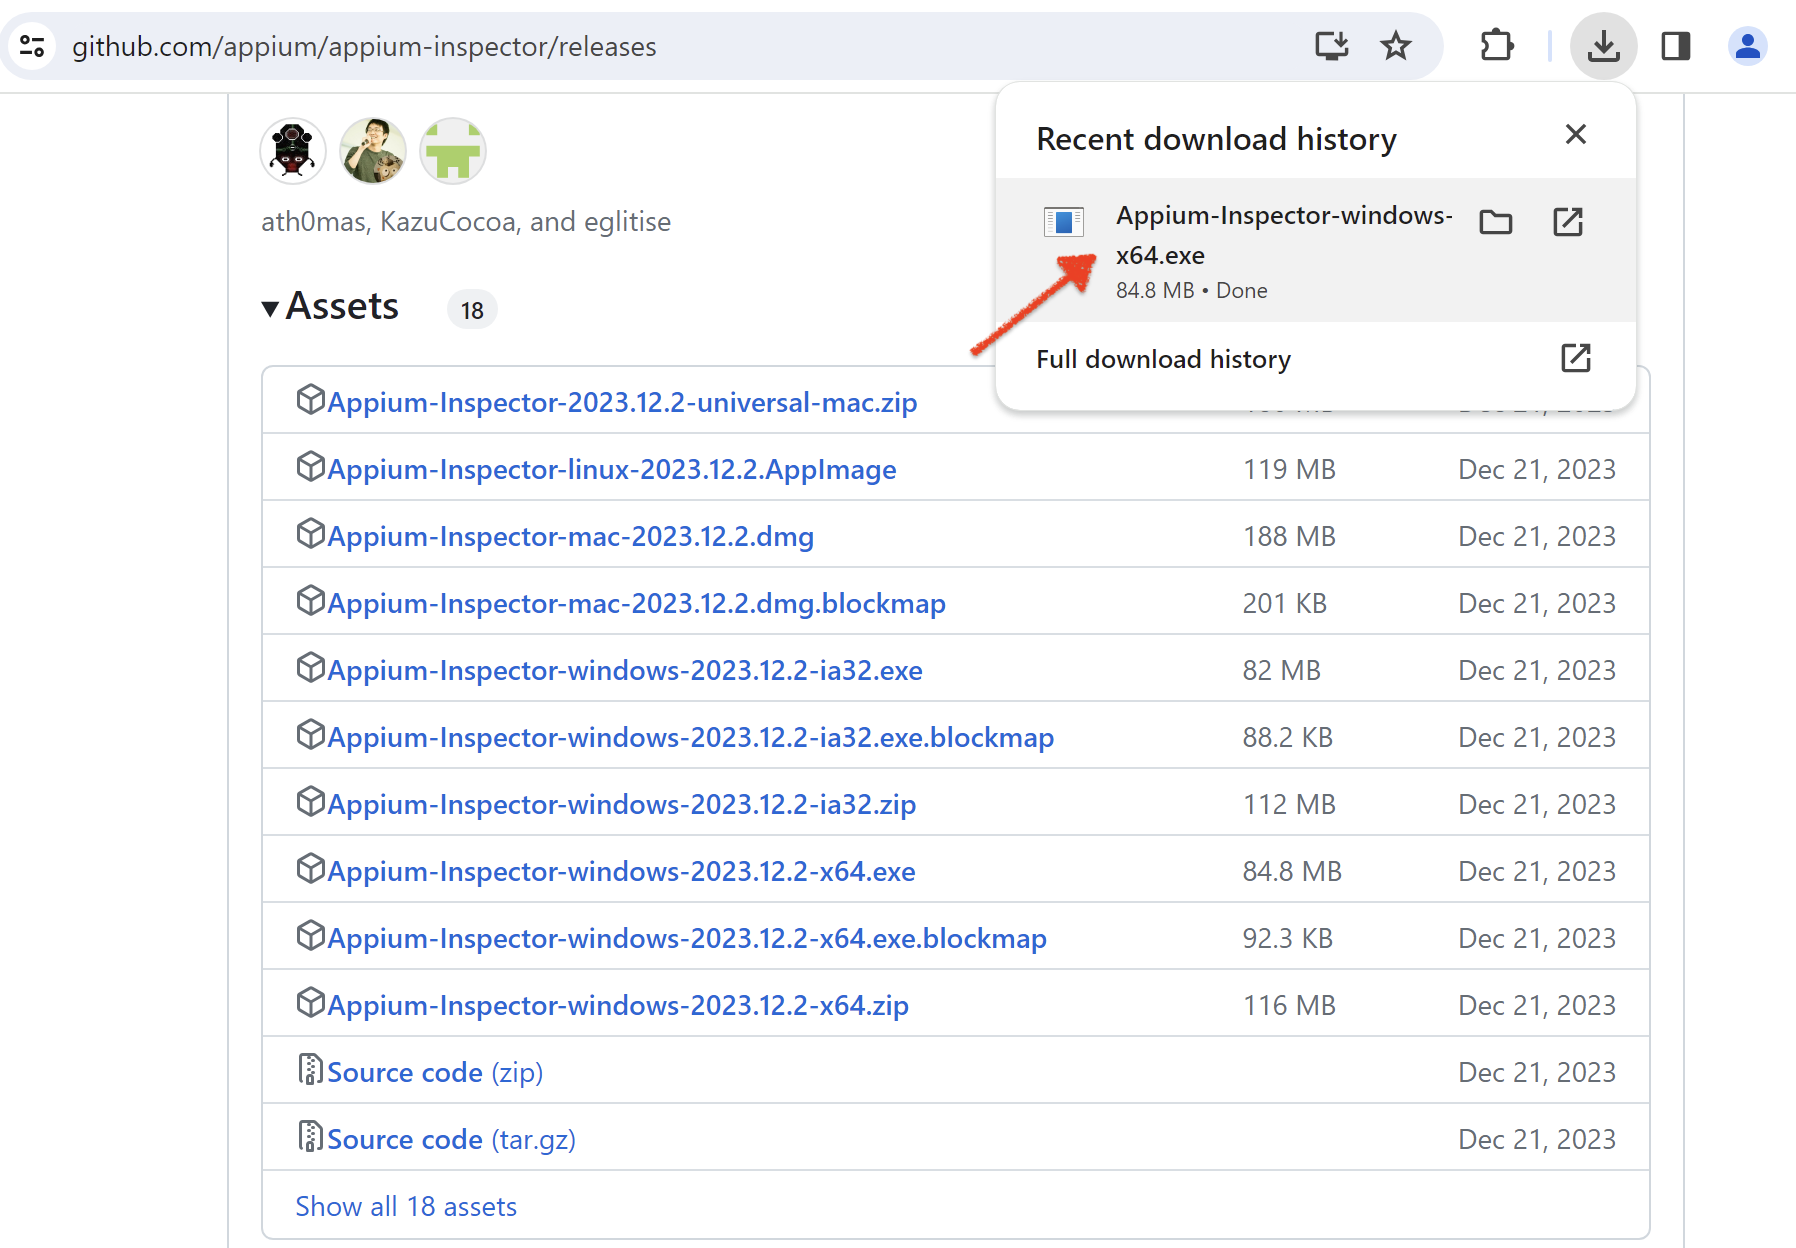
2. Go to Assets section. Based on whether your machine is 32-bit or 64-bit, click on corresponding windows exe file to download and save it on your machine
With this, we complete the download process for Appium Inspector. Let us now install it on our machine.
Install Appium Inspector
Follow the steps given below to install this tool on your machine –
1. Open the folder location where you have downloaded the inspector tool and double click on the exe to start the installation process
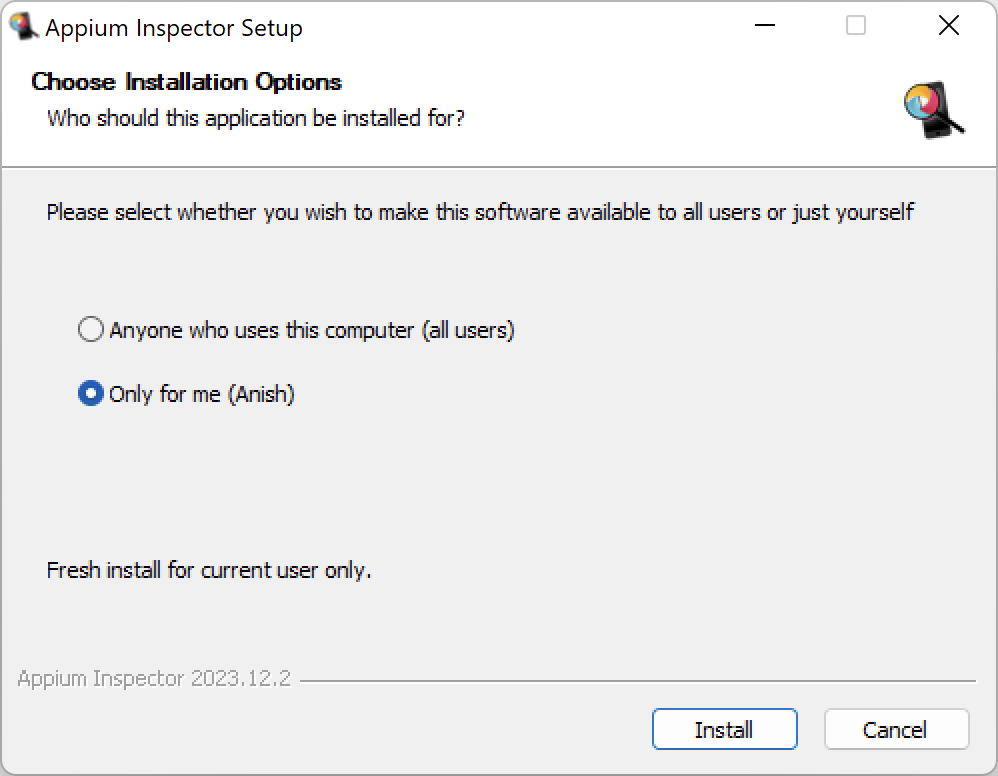
2. Appium will first ask you Installation Options. Leave the already selected option as it is and then click on Install button
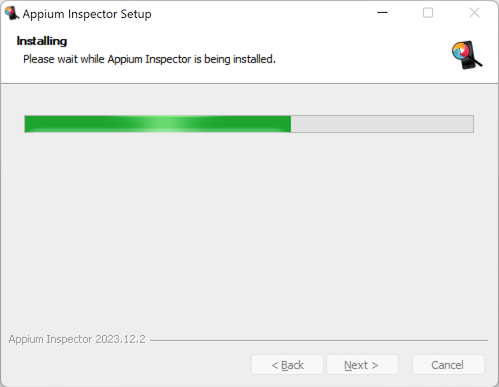
3. Once the installation process starts, you will see the Appium Setup window as displayed below
4. When the installation is completed, you will see the installation completed screen as shown below
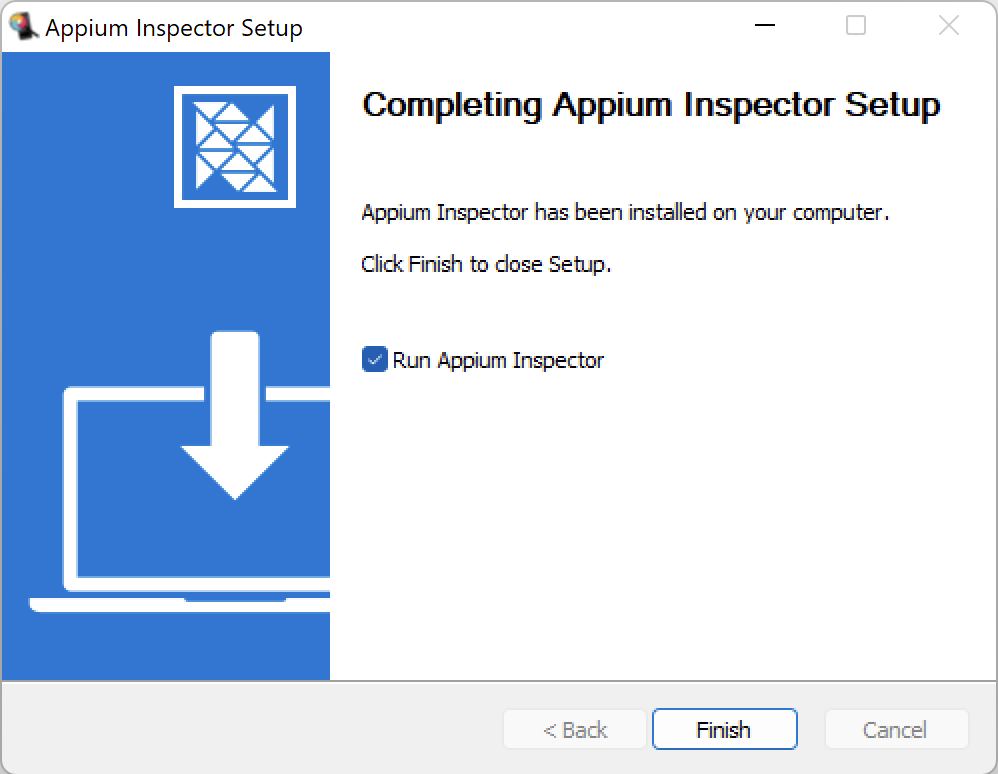
5. Now, leave the Run Appium Inspector option checked and then click on Finish button. Appium GUI window would open and it would look like this
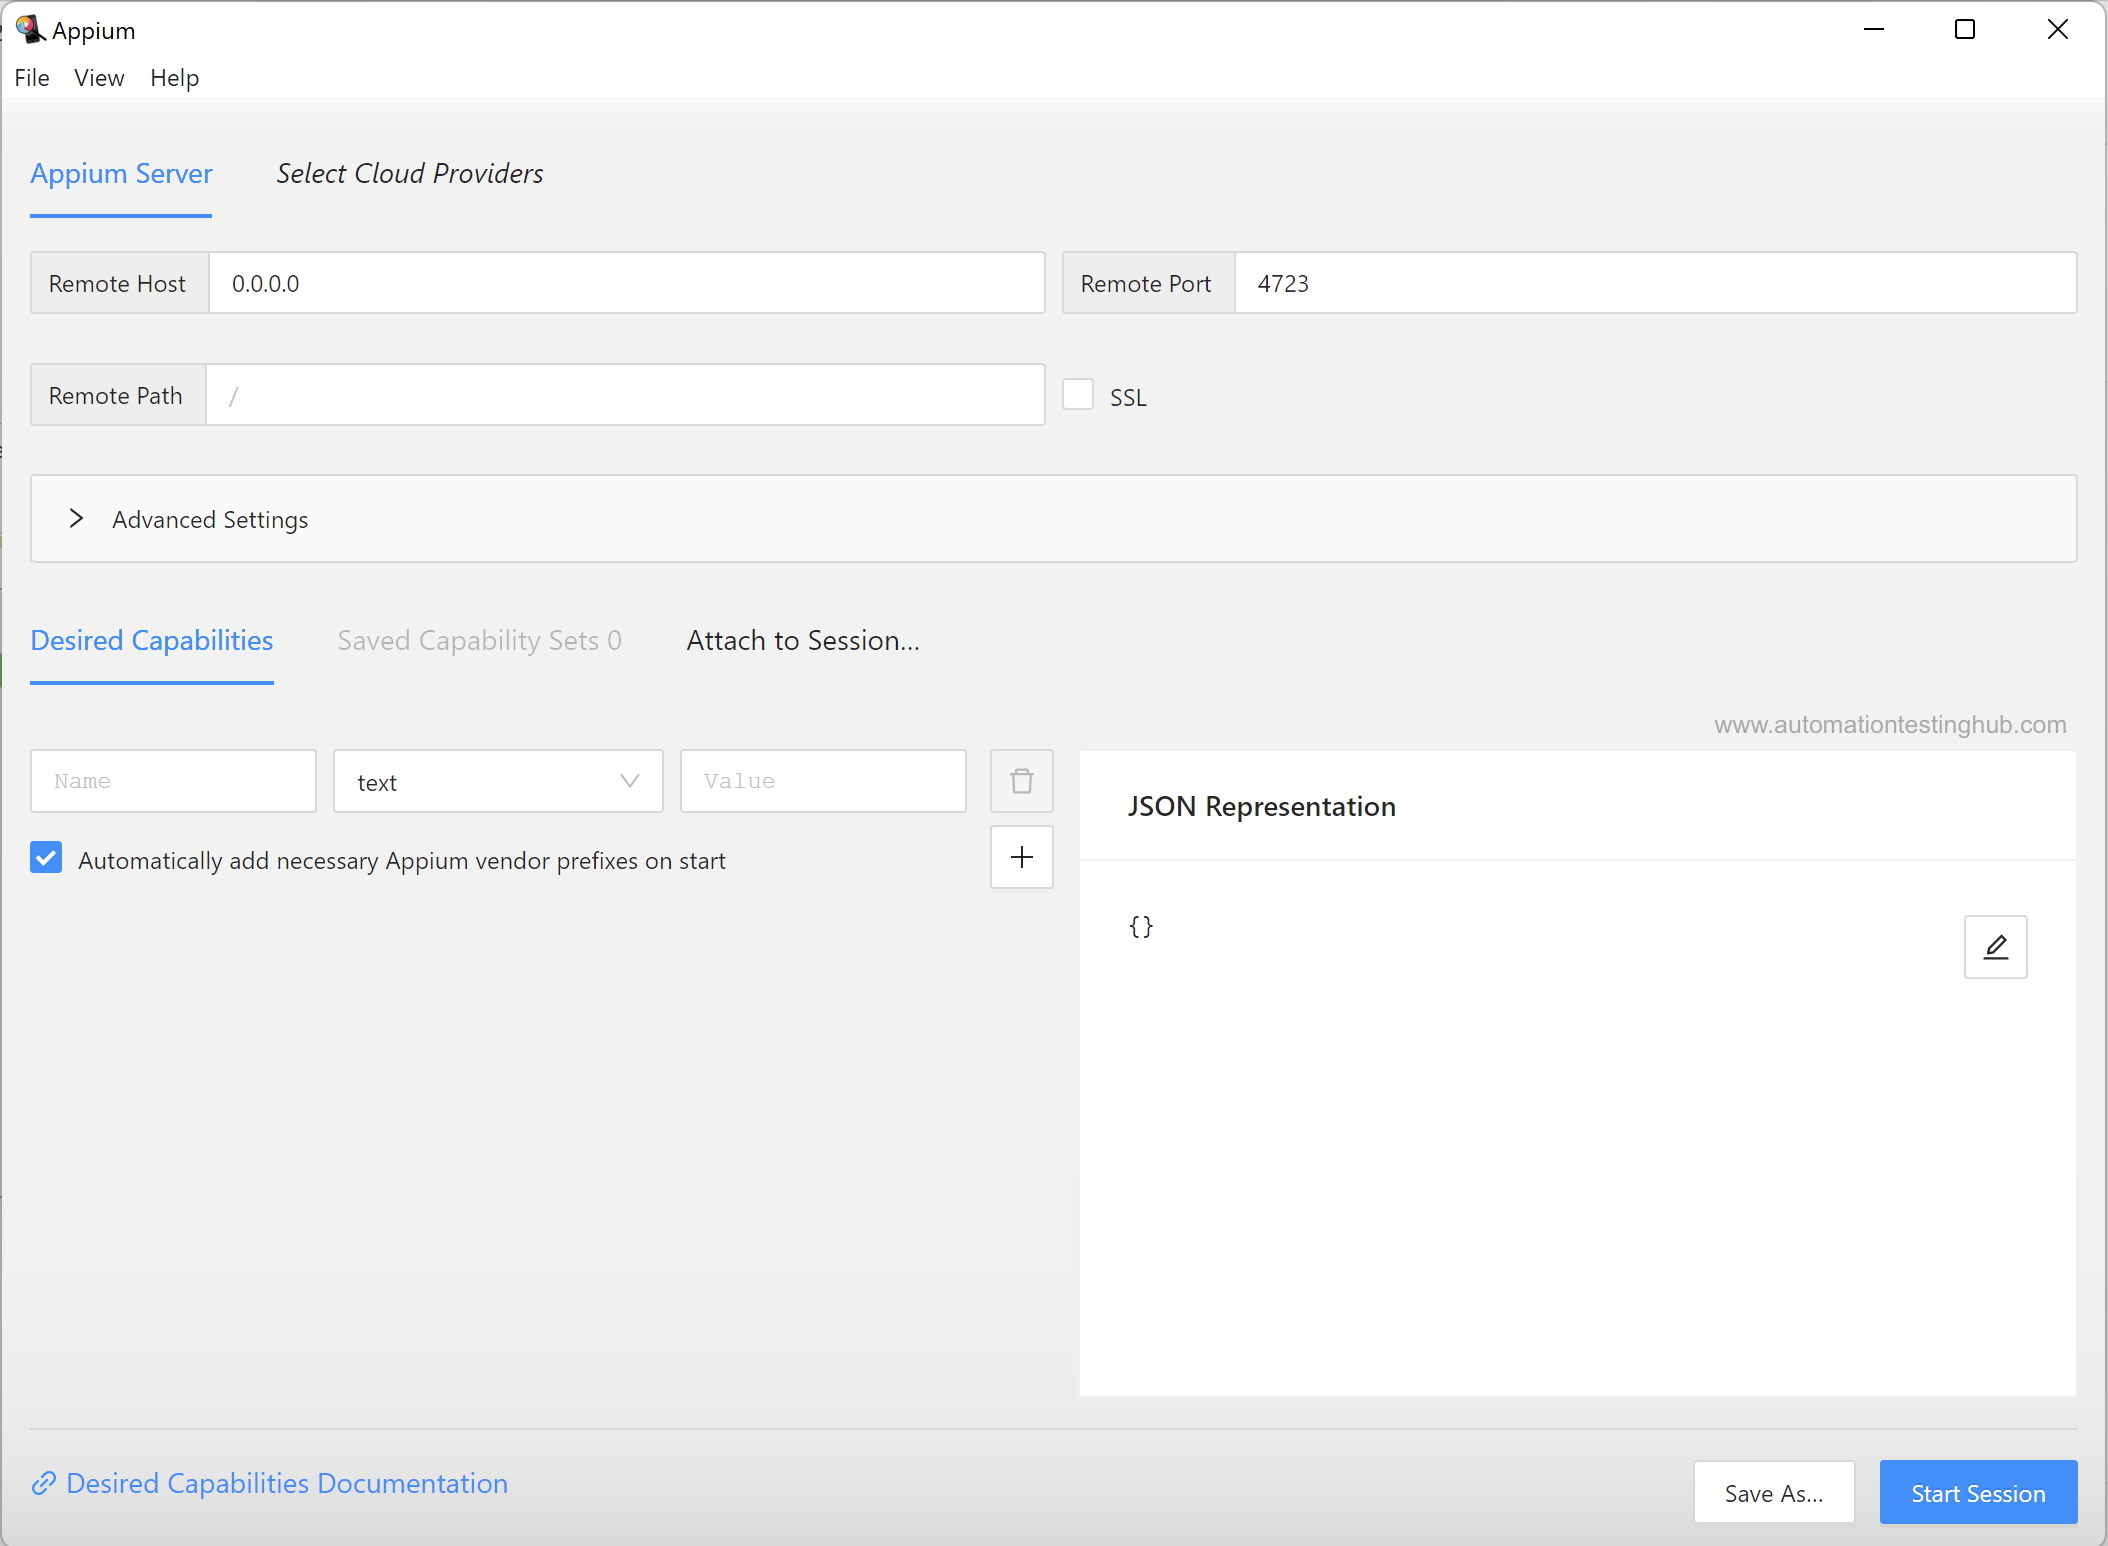
With this, you have finished the download and installation process of Appium GUI Inspector tool
Next Steps?
Head over to our Appium Tutorial page where we have more articles on Appium Inspector such as information on how to start Appium session and inspect mobile elements. We have also lot of articles to help you get started with Appium and write your first Appium test script
Appium Inspector for Windows Applications: A Comprehensive Guide
Appium is a popular open-source test automation framework for mobile applications. It allows you to test native, hybrid, and web applications on real devices or emulators. Appium Inspector is a tool that can be used to debug Appium tests. It provides a visual representation of the application under test, and allows you to inspect the DOM, stylesheets, and JavaScript code.
In this comprehensive guide, we will show you how to use Appium Inspector to debug your Appium tests. We will cover the following topics:
- Installing Appium Inspector
- Starting Appium Inspector
- Inspecting the application under test
- Inspecting the DOM
- Inspecting stylesheets
- Inspecting JavaScript code
By the end of this guide, you will be able to use Appium Inspector to debug your Appium tests and identify and fix any problems.
Why Use Appium Inspector?
There are a number of reasons why you might want to use Appium Inspector to debug your Appium tests.
- It provides a visual representation of the application under test. This can be helpful for identifying problems that are difficult to see in the console output.
- It allows you to inspect the DOM, stylesheets, and JavaScript code. This can be helpful for identifying problems with the application’s layout, styling, or JavaScript logic.
- It can be used to debug both native and web applications. This makes it a versatile tool that can be used to debug a wide range of applications.
How to Use Appium Inspector
Appium Inspector is a relatively easy tool to use. To get started, you will need to install Appium Inspector and the Appium client. Once you have installed these, you can start Appium Inspector and connect to your Appium server.
Once you are connected to your Appium server, you can start debugging your application. To do this, you will need to open the application under test and then click on the “Debug” button in Appium Inspector. This will open a new window that will show you a visual representation of the application under test.
You can use the various tools in Appium Inspector to inspect the DOM, stylesheets, and JavaScript code. To inspect the DOM, you can click on the “Elements” tab. This will show you a list of all of the elements in the application under test. You can then click on an element to see its properties and attributes.
To inspect the stylesheets, you can click on the “Styles” tab. This will show you a list of all of the stylesheets that are used by the application under test. You can then click on a stylesheet to see its contents.
To inspect the JavaScript code, you can click on the “Scripts” tab. This will show you a list of all of the JavaScript files that are used by the application under test. You can then click on a JavaScript file to see its contents.
Appium Inspector is a powerful tool that can be used to debug Appium tests. It provides a visual representation of the application under test, and allows you to inspect the DOM, stylesheets, and JavaScript code. This can be helpful for identifying and fixing problems with your Appium tests.
| Column 1 | Column 2 | Column 3 |
|---|---|---|
| Appium Inspector for Windows | A tool to inspect Appium sessions on Windows | https://github.com/appium/appium-inspector-windows |
| Features |
|
|
| Usage |
npm install -g appium-inspector-windows
appium-inspector-windows
|
See the documentation |
Appium Inspector Overview
Appium Inspector is a tool that allows you to inspect the DOM, hierarchy, logs, and animations of your mobile app. It is a powerful tool that can be used to debug your app and find problems.
What is Appium Inspector?
Appium Inspector is a Chrome extension that allows you to inspect the DOM, hierarchy, logs, and animations of your mobile app. It is a powerful tool that can be used to debug your app and find problems.
What are the benefits of using Appium Inspector?
There are many benefits to using Appium Inspector, including:
- It can help you debug your app. Appium Inspector allows you to see the DOM of your app, which can help you identify problems with the layout or the way your app is interacting with the DOM. You can also use Appium Inspector to see the hierarchy of your app, which can help you identify problems with the way your app is structured.
- It can help you find problems with your app’s animations. Appium Inspector allows you to see the animations of your app, which can help you identify problems with the way your app is animating. You can also use Appium Inspector to see the logs of your app, which can help you identify problems with the way your app is logging information.
How to install Appium Inspector?
To install Appium Inspector, you will need to have the following:
- A Chrome browser. Appium Inspector is a Chrome extension, so you will need to have the Chrome browser installed in order to use it.
- The Appium Inspector extension. You can download the Appium Inspector extension from the Chrome Web Store.
Once you have installed the Chrome browser and the Appium Inspector extension, you can open Appium Inspector by clicking on the “Appium Inspector” icon in the Chrome toolbar.
Appium Inspector Features
Appium Inspector has a number of features that can be used to inspect your mobile app. These features include:
- The DOM Inspector. The DOM Inspector allows you to see the DOM of your app. You can use the DOM Inspector to identify problems with the layout or the way your app is interacting with the DOM.
- The Hierarchy Inspector. The Hierarchy Inspector allows you to see the hierarchy of your app. You can use the Hierarchy Inspector to identify problems with the way your app is structured.
- The Logs Inspector. The Logs Inspector allows you to see the logs of your app. You can use the Logs Inspector to identify problems with the way your app is logging information.
- The Animations Inspector. The Animations Inspector allows you to see the animations of your app. You can use the Animations Inspector to identify problems with the way your app is animating.
Appium Inspector is a powerful tool that can be used to debug your mobile app. It has a number of features that can be used to inspect the DOM, hierarchy, logs, and animations of your app. If you are developing a mobile app, I highly recommend that you use Appium Inspector to help you debug your app.
Here are some additional resources that you may find helpful:
- [Appium Inspector documentation](https://appium.io/docs/en/inspector/)
- [Appium Inspector tutorials](https://appium.io/docs/en/inspector/tutorial/)
- [Appium Inspector forum](https://discuss.appium.io/c/inspector/23)
Appium Inspector is a tool that allows you to inspect the state of an Android or iOS app running on a device or emulator. It provides a visual representation of the app’s hierarchy, as well as information about the app’s properties, such as its name, version, and permissions. You can also use Appium Inspector to debug your app by inspecting its logs and seeing how it interacts with the underlying system.
To start Appium Inspector, open the Appium desktop app and click the “Inspector” tab. If you have not already connected a device or emulator, you will be prompted to do so. Once you have connected a device or emulator, Appium Inspector will automatically start inspecting the app that is currently running on the device.
Starting Appium Inspector
To start Appium Inspector, open the Appium desktop app and click the “Inspector” tab. If you have not already connected a device or emulator, you will be prompted to do so. Once you have connected a device or emulator, Appium Inspector will automatically start inspecting the app that is currently running on the device.
Connecting to a Device
To connect to a device or emulator, click the “+” button in the top left corner of the Appium Inspector window. This will open a dialog box where you can select the type of device you want to connect to.
- Android: Select “Android” and then enter the IP address of your device or emulator.
- iOS: Select “iOS” and then select your device from the list of available devices.
Once you have selected your device, click the “Connect” button. Appium Inspector will then connect to the device and start inspecting the app that is currently running on the device.
Inspecting an App
Appium Inspector provides a visual representation of the app’s hierarchy, as well as information about the app’s properties, such as its name, version, and permissions. To inspect an app, click on the app’s name in the list of apps. This will open the app’s hierarchy in the left-hand pane of the Appium Inspector window.
The app’s hierarchy is a tree-like structure that shows the relationship between the different components of the app. The topmost node in the hierarchy is the app’s root element. This element contains all of the other elements in the app, such as activities, views, and fragments.
You can click on any element in the hierarchy to inspect its properties. For example, if you click on an activity, you will see information about the activity’s name, class name, and state. You can also see the activity’s logs, which show information about the activity’s interactions with the underlying system.
Troubleshooting Appium Inspector
Appium Inspector can sometimes encounter problems. Here are some common problems and solutions:
- The app is not being inspected. Make sure that you have connected the device or emulator to Appium Inspector and that the app is running on the device.
- The app’s hierarchy is not being displayed. Make sure that you have selected the correct app in the list of apps.
- The app’s properties are not being displayed. Make sure that you have clicked on the correct element in the app’s hierarchy.
- The app’s logs are not being displayed. Make sure that you have enabled logging for the app.
If you are still having problems with Appium Inspector, you can consult the Appium Inspector documentation for more information.
Appium Inspector is a powerful tool that can be used to inspect the state of an Android or iOS app running on a device or emulator. It provides a visual representation of the app’s hierarchy, as well as information about the app’s properties, such as its name, version, and permissions. You can also use Appium Inspector to debug your app by inspecting its logs and seeing how it interacts with the underlying system.
If you are developing an Android or iOS app, Appium Inspector is a valuable tool that you should add to your toolkit. It can help you to identify and fix problems with your app, and it can also help you to understand how your app works.
Q: What is Appium Inspector?
Appium Inspector is a tool that allows you to inspect the elements of a mobile app running on a device or emulator. It provides a visual representation of the app’s hierarchy, allowing you to see the relationships between elements and identify their properties. You can use Appium Inspector to debug your app, identify potential problems, and find ways to improve its performance.
Q: How do I use Appium Inspector?
To use Appium Inspector, you will need to install the Appium Inspector app on your device or emulator. Once the app is installed, you can open it and connect to your appium server. You will then be able to see a visual representation of your app’s hierarchy. You can use the inspector to:
- Identify the elements of your app
- See the properties of elements
- Debug your app
- Identify potential problems
- Find ways to improve your app’s performance
Q: What are the benefits of using Appium Inspector?
There are many benefits to using Appium Inspector, including:
- It can help you debug your app. Appium Inspector can help you identify potential problems with your app, such as elements that are not being displayed correctly or elements that are not responding to user input.
- It can help you identify potential improvements for your app. Appium Inspector can help you identify ways to improve the performance of your app, such as by identifying elements that are taking too long to load or elements that are not being rendered efficiently.
- It can help you learn more about mobile app development. Appium Inspector can provide you with a visual representation of how mobile apps work, which can help you learn more about mobile app development.
Q: What are the limitations of Appium Inspector?
Appium Inspector does have some limitations, including:
- It can only be used to inspect apps that are running on a device or emulator. You cannot use Appium Inspector to inspect apps that are running in the cloud.
- It can only be used to inspect apps that are written in certain languages. Appium Inspector can only be used to inspect apps that are written in Java, Objective-C, or Swift.
- It can be difficult to use for beginners. Appium Inspector can be difficult to use for beginners, as it requires a certain level of technical knowledge.
Q: Where can I learn more about Appium Inspector?
There are a number of resources available online that can help you learn more about Appium Inspector, including:
- [The Appium Inspector documentation](https://appium.io/docs/en/latest/inspector/)
- [The Appium Inspector tutorials](https://appium.io/docs/en/latest/tutorial/inspector/)
- [The Appium Inspector forum](https://discuss.appium.io/c/inspector/)
- [The Appium Inspector community](https://community.appium.io/)
Appium Inspector is a powerful tool for debugging and testing Windows applications. It provides a visual interface that allows you to inspect the DOM, view network traffic, and debug JavaScript code. Appium Inspector is easy to use and can help you identify and fix problems in your Windows applications quickly and efficiently.
Here are some key takeaways from this article:
- Appium Inspector is a free and open-source tool.
- Appium Inspector is cross-platform and can be used to debug Windows applications on Windows, macOS, and Linux.
- Appium Inspector provides a visual interface that allows you to inspect the DOM, view network traffic, and debug JavaScript code.
- Appium Inspector is easy to use and can help you identify and fix problems in your Windows applications quickly and efficiently.
If you are developing or testing Windows applications, I encourage you to try Appium Inspector. It is a valuable tool that can help you improve the quality of your applications.
Author Profile
-
Hatch, established in 2011 by Marcus Greenwood, has evolved significantly over the years. Marcus, a seasoned developer, brought a rich background in developing both B2B and consumer software for a diverse range of organizations, including hedge funds and web agencies.
Originally, Hatch was designed to seamlessly merge content management with social networking. We observed that social functionalities were often an afterthought in CMS-driven websites and set out to change that. Hatch was built to be inherently social, ensuring a fully integrated experience for users.
Now, Hatch embarks on a new chapter. While our past was rooted in bridging technical gaps and fostering open-source collaboration, our present and future are focused on unraveling mysteries and answering a myriad of questions. We have expanded our horizons to cover an extensive array of topics and inquiries, delving into the unknown and the unexplored.
Latest entries
Appium is a powerful open-source tool designed to streamline UI automation across various platforms, including mobile, browser, desktop, and TV. It’s particularly useful for software test automation, allowing testers to evaluate app functionality through code in real-world scenarios. Appium unifies automation technologies, providing a user-friendly interface for multiple platforms, including Java, Python, Ruby, and JS.
Prerequisites
- Download Android Studio: Download Android Studio from the provided (Reference link). Skip this step if you’ve already downloaded it.
- Install Gradle: Download and install Gradle using the following (Reference link).
- Install Java JDK: Download and install Java Development Kit (JDK) from the following (Reference link). Skip this step if you’ve already downloaded it.
- Install Python: Download and install Python from the following (Reference link). Skip this step if you’ve already downloaded it.
Installation of Appium on Windows Using Python
Step 1: Install Appium Inspector
Download Appium Inspector from this link(https://github.com/appium/appium-inspector/releases). Double-click the executable (exe) file, a window appears with a caution against running the application.

Select «More info.»

Click «Run anyway» and choose «Only for me» for installation.

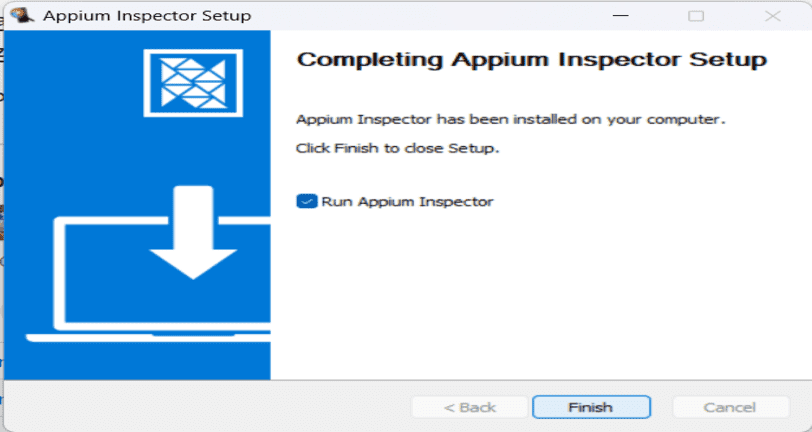
Finish the download and run Appium Inspector.

Step 2: Install Appium Server
Download Node.js from this link. Reference link. Run the following command in the command prompt:
npm install -g appium
.png)
Start Appium using:
appium -p <port number>
.png)
Obtain the port number from Appium Inspector.
.png)
The Appium Server is now running.
Step 3: Install UiAutomator2 and Chromium Drivers
Run the following commands in the command prompt:
appium driver install uiautomator2
appium driver install chromium
.png)
Step 4: Install PyCharm
Follow the installation steps for PyCharm here. Skip if already installed. Create a new project in PyCharm.
.png)
After creating a new project, access the settings.
Navigate to the Python Interpreter tab and click on the ‘+’ symbol.
-(1).png)
Search for «Appium-Python-Client» in the search bar and proceed to install the package
-(1).png)
Your Python project is now set up and equipped with the necessary modules installed.
Step 5: Set Up the Emulator
Open Android Studio and click on Device Manager. By default, you’ll find a virtual device. Run the device to proceed.
.png)
Click on the play button next to the device to launch the emulator.
Open the command prompt and execute to display the list of connected devices.
adb devices
The connected device running in the emulator will be displayed.
.png)
Configuration with Respect to Python
Ensure Python is Installed
Make sure that Python 3.x is installed on your system. You can download and install Python from the official website: Python Downloads
Install Required Python Libraries:
Open a command prompt and install the necessary Python libraries for Appium using the following command:
pip install Appium-Python-Client
.png)
Save and Restart Appium
After installing the required Python libraries, save the configuration in the Appium server and restart it. This can be done through the Appium Desktop application or the command line.
Configure Python Interpreter in PyCharm
If you’re using PyCharm as your IDE, open the settings, navigate to the Python Interpreter tab, and add the installed Appium-Python-Client package to the project interpreter.
With these steps, you ensure that Python is set up correctly to work with Appium for automation scripts. It ensures that the Appium server recognizes Python as a supported language for creating automation scripts.
Simple Python automation Script on the Appium
Step 1: Start the Appium server
Start the Appium server using in command prompt
appium -p <port number>
.png)
Step 2: Launch the emulator through Android Studio.
Initiate the emulator in Android Studio by navigating to Device Manager, and then click the play button next to the virtual device.
Step 3: Execute the Python code
In this code, an Appium driver is initialized for an Android emulator. Using the driver, an element with the text «Battery» in Android settings is located and clicked. Finally, the Appium driver session is terminated. This code provides a foundational understanding of an Appium script, covering steps from connecting to the server to interacting with a specific UI element.
Python
# Import necessary modules
from appium import webdriver
from typing import Any, Dict
from appium.options.common import AppiumOptions
from appium.webdriver.common.appiumby import AppiumBy

# Set desired capabilities for the Android emulator
cap: Dict[str, Any] = {
    "platformName": "Android",
    "appium:automationName": "uiautomator2",
    "appium:platformVersion": "14",
    "appium:deviceName": "emulator-5554",
    "appium:appPackage": "com.android.settings",
    "appium:appActivity": ".Settings"
}

# Appium server URL
url = "http://localhost:4723"

# Initialize the Appium driver with the specified capabilities
driver = webdriver.Remote(url, options=AppiumOptions().load_capabilities(cap))

# Find an element by XPATH and click on it (e.g., element with text "Battery")
el = driver.find_element(by=AppiumBy.XPATH, value='//*[@text="Battery"]')
el.click()

# Quit the Appium driver
driver.quit()
Output:
C:\Users\guest\PycharmProjects\pythonProject\.venv\Scripts\python.exe
C:\Users\guest\PycharmProjects\pythonProject\.venv\appium_python.py
Process finished with exit code 0
Emulator
The Settings app will open. Appium successfully opens the app.
Appium Server Logs
.png)
Video Demonstration
https://drive.google.com/uc?id=1bX4iqaSQPW1GXgPpGXWIFmaZyMdLwFUm&export=download
This Python code effortlessly launches the Settings app using the Appium server. In summary, Appium streamlines UI automation on Windows, providing a straightforward way to test software across diverse platforms. This covers a simple installation and execution of a basic program.