
Monitoring services for uptime and performance is a crucial part of any organization’s day-to-day operations. Essentially since its inception, Apache Web Server (Apache HTTPD) has been among the three most popular web servers on the internet. It has been providing critical hosting services to hundreds of millions of web sites commanding a share of over 31% of all installations.
Apache HTTPD is not only used for serving websites and static pages but is also used as a Caching Server but also as a Load Balancer distributing requests among multiple other web services.
At its hears Apache HTTPD is a core system whose functionality has been extended through pluggable modules which can easily be enabled through configuration file settings.
Monitoring Apache Natively Using MOD_STATUS
Apache provides a module MOD_STATUS that provides the ability to the server administrator to find out how well their serve is performing. This module provides details on the following variables:
- The number of workers serving requests
- The number of idle workers
- The status of each worker: Number of requests that worker has performed and the total number of bytes served by the worker.
- Total number of incoming requests.
- Count of data severed with “Bytes count served”.
- Server lifecycle info: The time the server was started/restarted and the time it has been running for
- Averages
- number of requests/second
- number of bytes served/second
- average number of bytes/request
- The current percentage CPU used by each worker and in total by all workers combined.
- The current hosts and requests being processed.
Note: MOD_STATUS provides monitoring statistics on the web server itself. It does not provide any info on web applications running on the server.
Enable MOD_STATUS Configuration
In this section I will go over details of how to setup Apache HTTPD with MOD_STATUS, enabling collection of important server statistics. Since Apache HTTPD runs on multiple platforms, I will details steps to enable configuration on Linux and Windows. Listed below if my Test Environment setup.
| Linux | Windows | |
| Operating System | Ubuntu 22.04 | Windows 10 |
| Apache HTTPD version | 2.4.6 | |
| Configuration file location | /etc/apache2/httpd.conf*
In case of virtual server setup use config file under the following path: /etc/apache2/sites-enabled/{website.conf} |
{install location}\conf\httpd.conf |
| HTTP port | 80 | 80 |
Step 1: Edit httpd.conf File
Find the following entry in the config file
#LoadModule status_module modules/mod_status.soRemove the leading # (which denotes that the module MOD_STATUS is disabled) and save the file.
Step 2: Edit httpd.conf or Appropriate Virtual Host Config File
If you server is setup serving multiple websites then you need to edit the appropriate config file.
For example if you are serving the domain example.com, then you need to look in the folder /etc/apache2/sites-enabled/example.conf and open it in your favorite editor.
If you are only serving one website in the default config then you will find the host settings in /etc/apache2/sites-enable/default.
Add the following to your config file if using default Apache Install. Just search for <Location> tag and change to the following:
<Location /server-status>
    SetHandler server-status
    Order allow,deny
    Deny from all
    Allow from all
</Location>
There are 2 things to note in this code:
- Location: This is the URL where you will find the status information for your Apache Web Server (HTTPD). If your server is running our sample domain example.com, then you will find the status page on https://example.com/server-status.
- SetHandler: This config variable tells Apache that when the user view the Location, then load the handler server-status (part of MOD_STATUS which we enable earlier in httpd.conf file).
Using the configuration below you can limit access to the /server-status URL only from localhost.
<Location /server-status>
    SetHandler server-status
    Allow from localhost
</Location>
You can also restrict access to authenticated users with the following configuration settings.
<Location /server-status>
    SetHandler server-status
    AuthUserFile /passwordlocation
    AuthType Basic
    AuthName <USER_NAME>
    Require user <USER_NAME>
</Location>
You can check all options available for <Location/> node in the Apache documentation.
If you are using virtual host then you need to add the <Location> code shown above under the <VirtualHost> tag as shown below:
<VirtualHost *:80>

    ServerAdmin [email protected]
    DocumentRoot /var/www/html/example # should be your actual path where the website files are kept
    ServerName example.com
    ErrorLog logs/example.com-error_log
    CustomLog logs/example.com-access_log common

    <Location /server-status>
       SetHandler server-status
       Order allow,deny
       Deny from all
       Allow from example.com
    </Location>

</VirtualHost>
Regarding ExtendedStatus Setting
In the past certain monitoring values are only enabled if the ExtendedStatus was set to On in the httpd.conf file. Since version 2.3.6 of the Apache HTTPD, these extended settings have been set to On by default. If you are using a version previous to 2.3.6 then you will want to add the following to you httpd.conf file.
Step 3: Test and Restart Apache HTTPD
You can test the config file by type the following command in the shell.
user@host ~# sudo apachectl configtestIf there are no errors you can restart the Apache HTTPD.
user@host ~# sudo service apache2 restartViewing and Understanding Active MOD_STATUS web page
Once your server restarts, it will start collecting statistics for monitoring and performance of the server. Type the following URL in the browser to view available statistics.
http://example.com/server-status
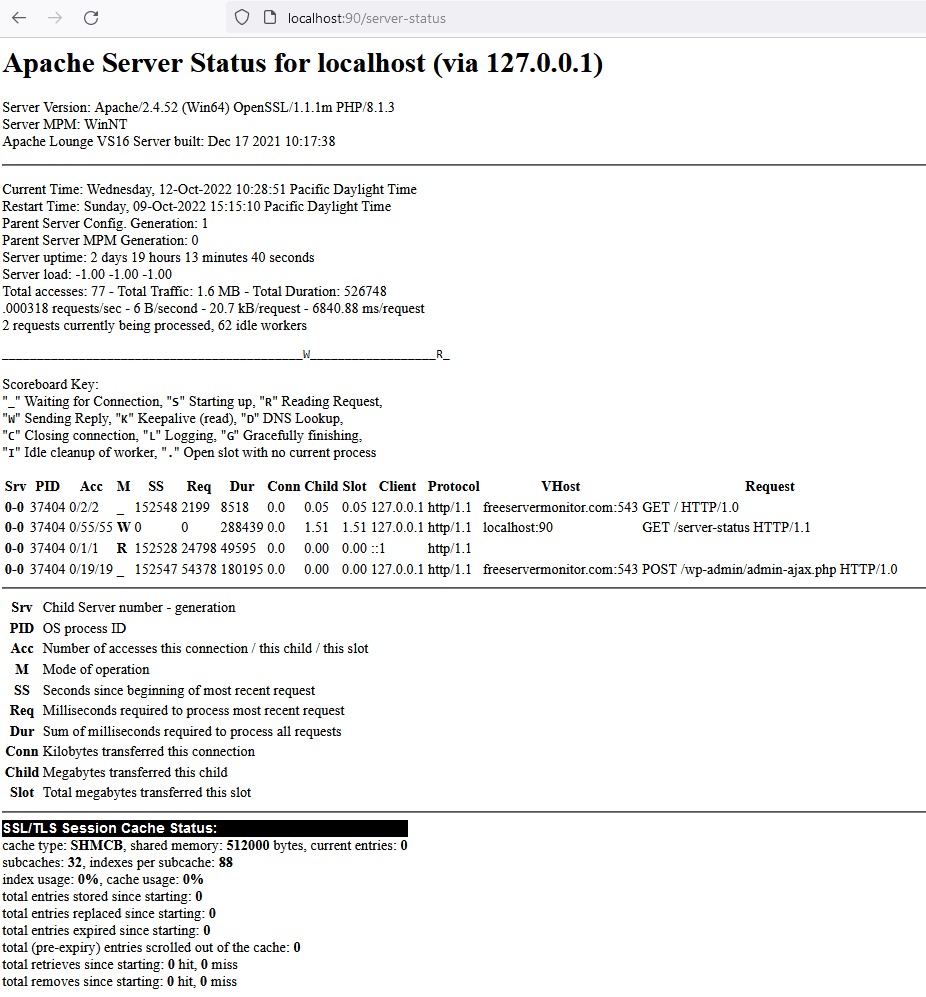
Your screen will look similar to the screenshot shown below.
Note: You can use the URL http://example.com/server-status?refresh=N to refresh the page every N seconds
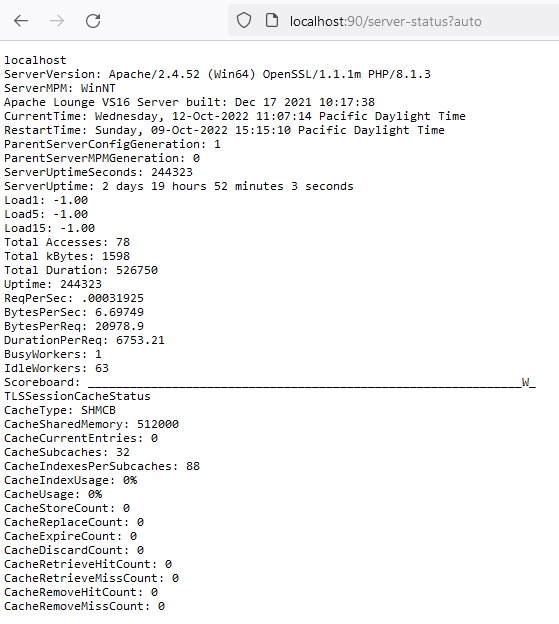
There is also an option to get the statistics in a machine readable format which allows easier integration with upstream monitoring tools. Use the URL http://your.server.name/server-status?auto to access statistics in this format. Below is the sample output.
Understanding Variables Shown on the Auto Web Page
Server Information Section
Hostname
Shows the name of the host/domain.
ServerVersion
This provides information on the Apache server version, including platform. In the image above you can see that Apache version 2.4.52 is running on 64bit version of Windows and has both OpenSSL and PHP enabled.
ServerMPM
Provides detail of the Multi-Processing Module(MPM) that is enabled on the server. Apache has the following three MPM modules available.
worker
The worker MPM causes Apache to fork into several processes so that a single crash does not kill the entire Apache process. Each forked process creates numerous threads and a listener thread that listens for connections. This enables the system to serve multiple requests concurrently.
event
Event MPM serves a single HTTP request across multiple threads. However, the event MPM uses a dedication system and dedicates a thread to handle all live connections. The system allocates a request to the child threads only when it receives a request. This allows the threads instant availability after the request finishes.
This MPM model is great We recommend this MPM for users that only make occasional concurrent requests, or when a user requires a long keep-alive timeout.
prefork
The prefork MPM causes Apache to fork into additional processes before the system receives requests. When the server receives requests, it responds quickly to each request because an Apache process already exists to handle it. If a problem occurs with an individual process, the system can kill the process with no effect on the other Apache processes.
This module is not multi-threaded therefore each process handles multiple requests synchronously. Consumes many resources and not the best option.
Suggestion: Use event MPM for generally the best performance.
Build Information
Provides information on the build. In my case, I am using Apache Lounge for the build.
CurrentTime
Current date and time on the machine running the Apache HTTPD Web Server. May be different from your local time depending on the machine where the server is running.
RestartTime
When the server was started/restarted.
ServerUptimeSeconds
Time in seconds since the server was started/restarted.
ServerUptime
Basically, this line converts the value from Line 9 to a more human readable string.
Server Information Section
Load1
Displays 1-minute load average.
Load5
Displays 5-minute load average.
Load15
Displays 15-minute load average.
Total Accesses
The total number of direct URL accesses on the server is monitored using this metric.
Total kBytes
Total kilo-bytes of data that has been sent over the network.
Total Duration
This shows the total time taken to process incoming requests. Since multiple threads may be serving incoming client requests, this number should be higher than the ServerUptime metric.
Uptime
The metric Uptime gets the total amount of time the server has been up and running. This should match the ServerUptimeSeconds.
ReqPerSec
Total number of client requests served across all threads/process of Apache HTTPD.
BytesPerSec
Total number of bytes sent over the network in response to incoming client requests across all threads/process of Apache HTTPD.
BytesPerRequest
Average bytes sent in response to all incoming requests. This is an actual average and not a mean.
BytesPerRequest
Average bytes sent in response to all incoming requests. This is an average and not a mean.
DurationPerRequest
Average time in seconds taken to process a single incoming request. This is an average and not a mean.
BusyWorkers
Show the total number of works actively serving incoming requests. The higher the number shows that your server is actively processing requests. The higher this number goes lower will be the IdleWorkers count.
IdleWorkers
Total number of workers available in the pool to serve incoming requests. If you have very few or no idle processes, it means your server is using up all the server resources and is likely to queue up incoming requests.
This results in a poor user experience for the visitors as the time taken for them to view results is going up due to a lack of resources available to process requests. You should evaluate your configuration settings and may look into increasing resources serving clients.
TLSSessionCacheStatus
Many of the metrics in the TLS section can be configured in the httpd-ssl.conf file. These are available only if you have MOD_SSL enabled for Apache HTTPD.
CacheType
I am using SHMCB. The other options available are DBM, DC, MEMCACHE, REDIS and SHMCB.
CacheSharedMemory
This metric shows the cache memory available to TLSSession. If you find that CacheIndexUsage is getting over 80% then you will want to increase the shared memory cache size.
There are other metrics available under the Caching category but I focus mostly on the CacheSharedMemory and CacheUsage.
Using MOD_STATUS to Troubleshoot Server Issues
To find out which requests or clients are causing unwanted behavior on the server you can use the /server-status page as a starting place for troubleshooting a situation where your server is consuming available resources such as CPU or memory.
Note: If using a version prior to 2.3.6, make you have ExtendedStatus set on. This way you can see the full request and client information for each child or thread.
Now using a command line tool such as top (or similar process viewing utility) identify processes hogging resources. Refresh /server-status page and you will be able to identify what request is being served by that process. This will allow you to isolate the client causing the issues. Since web server requests are transient you may need to refresh the status page a few time before you can identify the exact client causing the issue.
This process should give you some idea of what client, or what type of requests, are primarily responsible for your load problems. Often you will identify a particular web application that is misbehaving or a particular client that is attacking your site.
Conclusion
In this post, I went over details of how to use Apache Mod_Status to monitor internal Apache key performance indicators. I also showed how you can also get operating system resource consumption statistics as well.
There is a lot more to running an optimized installation of the Apache web server and I will be bringing you more information on that in the future.
For other guides and posts on Apache check out our main Apache web server page. New updates will also be posted on this page.
Table of Contents
- Introduction
- Enabling mod_status
- Understanding mod_status Output
- Access Control
- Configuring mod_status for Extended Information
- Automating Monitoring with cron and mod_status
- Advanced Localization and Customization
- Conclusion
Introduction
Apache is one of the most popular web servers used to serve websites on the Internet today. Monitoring the performance and health of an Apache server is crucial for maintaining the quality of service and uptime. The Apache mod_status module is an invaluable tool for monitoring the Apache web server’s performance in real-time. This tutorial will guide you through setting up the mod_status module, understanding its output, and utilizing it to monitor your web server and current connections.
Enabling mod_status
To begin using mod_status, you must ensure it is enabled in your Apache configuration. This is typically done in your httpd.conf or apache2.conf file with the following lines:
LoadModule status_module modules/mod_status.so
<IfModule mod_status.c>
    ExtendedStatus On
    <Location "/server-status">
        SetHandler server-status
        Require host localhost
    </Location>
</IfModule>
Make sure to restart your Apache web server after modifying the configuration for the changes to take effect.
Note: In certain distributions like Ubuntu, you might need to enable the module with a2enmod status command and then restart the server.
Understanding mod_status Output
The mod_status module provides a webpage accessible at http://your.server.address/server-status by default, displaying various metrics about the server’s performance. Here is an abbreviation of what you might see:
Server Version: Apache/2.4.29 (Ubuntu)...
Server MPM: prefork
Current Time: Wednesday, 05-Apr-2023 15:15:31 UTC
Restart Time: Monday, 03-Apr-2023 11:11:11 UTC
Parent Server Config. Generation: 3
Parent Server MPM Generation: 2
Server uptime: 2 days 4 hours 4 minutes 20 seconds
Server load: 0.55 0.51 0.48
...
This screen displays information about the server version, the Multi-Processing Module (MPM) in use, server uptime, and the current server load, among other things.
Access Control
It’s important to control who can access the /server-status page. For better security, it’s recommended to restrict access to local connections or to specific IP addresses. Here’s an example of how to restrict access to the server-status page to the localhost:
<Location "/server-status">
    SetHandler server-status
    Require local
</Location>
If you want to allow access from a specific IP, you can use Require ip your.ip.address.here instead of Require local.
Configuring mod_status for Extended Information
The ExtendedStatus directive allows you to collect more detailed information about each request being processed. With this directive enabled, you’ll see a list of connections with information on the client IP, request, and more.
Example: Enabling ExtendedStatus can be done in the httpd.conf file alongside the initial setup:
ExtendedStatus OnAfter enabling this feature, the server status page will show more detailed information such as:
Srv PID Acc M CPU SS Req Conn Child Slot Client VHost Request
0-0 12345 0/8/8 _ 0.17 14 0 0.0 0.03 0.20 127.0.0.1 localhost GET /server-status HTTP/1.1
...
Automating Monitoring with cron and mod_status
For automated monitoring, you can use a cron job to regularly check the server status and log the results. Here’s an example script that logs the server load every minute:
* * * * * curl -s http://localhost/server-status?auto | grep 'Load' >> /var/log/apache2/server_load.logThis line in a crontab file will instruct the server to record the server load to a log file every minute.
Advanced Localization and Customization
If you have multiple virtual hosts, you may want to isolate the statistics for each one. Here’s a configuration snippet for isolating stats in a virtual host:
<VirtualHost *:80>
    ...
    <Location "/server-status">
        SetHandler server-status
        Require local
    </Location>
</VirtualHost>
Custom styling and configuration logic can be achieved using mod_rewrite and server-side scripts to render the status page differently.
Conclusion
This tutorial has covered the setup and use of Apache’s mod_status module to monitor your web server. Following these steps and examples, you can obtain valuable insights into how your web server is performing and handling connections. Observing and analyzing your server’s status can help you make informed decisions to keep your website running smoothly and reliably.
Administration, Apache, Apache HTTPD, Apache HTTPD Administration, Apache HTTPD Config, Browser Based, Home Lab, How To, How To Setup Mod_status In Apache HTTPD, HTTPD, i12bretro, mod_status, PHP, Self-hosted, system administrator, system monitoring, Tutorial, Web Based Tools, web developer, Web Server, Web Server Administration
1 Minute
View interactive steps on GitHub
- Navigate to the PHP install directory
- Edit /php.ini
- Press CTRL+F, type curl, press Enter
- Uncomment the extension to enable it by removing the ; at the start of the line
extension=curl
- Navigate to the Apache install directory
- Edit /conf/httpd.conf
- Press CTRL+F, type mod_status, press Enter
- Uncomment the module to enable it by removing the # at the start of the line
LoadModule status_module modules/mod_status.so
- At the bottom of the file paste the following
ExtendedStatus On
<location /server-status>
SetHandler server-status
Order allow,deny
Allow from all
</location> - Note: By default this will only allow access from the host Apache is running on
- Restart the Apache service to apply the changes
- Open a web browser and navigate to http://DNSorIP/server-status
- ?refresh=5 will refresh the display every 5 seconds
- ?auto will display the output in a text only format
- Cringe at the output displayed
Style and Modernize /server-status
- Download PHP Simple DOM Download Documentation
- Create a status folder inside apache/htdocs
- Copy/Paste simple_html_dom.php inside apache/htdocs/status
- Download server-status.php Download
- Copy/Paste server-status.php inside apache/htdocs/status
- Open a web browser and navigate to http://DNSorIP/status/server-status.php
- ?getStatus will return a JSON output of the server-status data
Published
Apache · December 17, 2023
Apache is one of the most popular web servers in the world, known for its flexibility and robustness. It offers a wide range of modules that enhance its functionality and allow administrators to monitor and manage their server effectively. One such module is mod_status, which provides detailed information about the server’s current status and performance.
What is mod_status?
Mod_status is an Apache module that enables server administrators to monitor the performance and status of their Apache web server. It provides a simple HTML interface that displays real-time information about the server’s current state, including the number of requests being processed, the number of idle workers, and the server’s uptime.
By enabling mod_status, administrators can gain valuable insights into their server’s performance, identify potential bottlenecks, and troubleshoot any issues that may arise. It allows them to make informed decisions and optimize their server’s configuration for better performance.
Enabling mod_status
To enable mod_status, you need to make a few changes to your Apache configuration file. First, ensure that the mod_status module is installed on your server. You can check this by running the following command:
apachectl -M | grep status_moduleIf the module is not listed, you will need to install it. On most Linux distributions, you can use the package manager to install the module. For example, on Ubuntu, you can run:
sudo apt-get install libapache2-mod-statusOnce the module is installed, you need to enable it by adding the following lines to your Apache configuration file:
<Location /server-status>
    SetHandler server-status
    Require ip 127.0.0.1
</Location>
This configuration restricts access to the server status page to requests originating from the localhost. If you want to allow access from other IP addresses, you can modify the “Require” directive accordingly.
After making these changes, restart your Apache server for the changes to take effect.
Accessing the server status page
Once mod_status is enabled, you can access the server status page by visiting the following URL:
http://your-server-ip/server-statusReplace “your-server-ip” with the actual IP address or domain name of your server.
On the server status page, you will see a table with various columns that provide information about the server’s current state. Some of the key columns include:
- Server uptime: The total time the server has been running.
- Total accesses: The total number of requests processed by the server.
- CPU usage: The percentage of CPU usage by the server.
- Requests per second: The average number of requests processed per second.
- Bytes per second: The average number of bytes transferred per second.
These metrics can help you gauge the server’s performance and identify any anomalies or issues that may require attention.
Summary
Mod_status is a valuable Apache module that allows server administrators to monitor and manage their Apache web server effectively. By enabling mod_status, administrators can gain insights into their server’s performance, identify bottlenecks, and troubleshoot any issues that may arise. To enable mod_status, make the necessary changes to your Apache configuration file, and access the server status page to view real-time information about your server’s current state.
If you are looking for reliable and high-performance VPS hosting solutions, consider USAVPS. With a wide range of plans and excellent customer support, USAVPS is a trusted provider in the industry.
Время на прочтение3 мин
Количество просмотров8.5K
Как получить данные о работе web сервера Apache и представить их в удобном для анализа виде.?
Начнём с получения данных.
Для того этого, необходимо подключить модуль mod_status. Он отслеживает работу сервера и показывает данные в виде обычной html страницы. С его помощью можно узнать:
1 количество процессов, выполняющих обработку запросов;
2 количество процессов, которые находятся в состоянии ожидания;
3 состояние каждого процесса, число обработанных им запросов и переданных данных;
4 общее количество запросов и переданных данных;
5 время работы сервера (запуск, перезапуск и общее время работы (uptime));
6 общая статистика: среднее число запросов в сек, байт на запрос, байт в сек;
7 использование CPU каждым процессом отдельно и apache’ем в целом в данный момент;
8 хосты и их запросы, которые обрабатываются в данный момент.
Переходим к настройке
1 Подключаем модуль.
Для этого в файле httpd.conf снимаем комментарий со строки
LoadModule status_module modules/mod_status.so
2 И открываем доступ к статистике. Добавляем в httpd.conf следующие строки
# включаем расширенную статиститку

ExtendedStatus On
<Location /server-status>
SetHandler server-status
Order Deny,Allow
Deny from all
Allow from 127.0.0.1
Примечание. Здесь мы разрешили доступ к статистике только для адреса 127.0.0.1 (localhost). Для тестирования удаленного сервера вам нужно будет эту настройку изменить.
3) Перезапускаем apache.
Теперь можно просматривать статистику.
Для этого вводим в браузере URL
localhost/server-status
или, если вы хотите, чтобы страница обновлялась автоматически
localhost/server-status?refresh=15
(вместо цифры 15 ставите задержку в секундах).
Есть ещё один вариант страницы с этими же данными:
localhost/server-status?auto&refresh=3
Как видите, данные мы получили, но анализировать их, глядя на стандартную страницу не очень удобно.
Например, на скриншоте показано состояние процессов apache.
Символ подчеркивания означает, что процесс ожидает соединения, буква «W» — отправка ответа, точка – открытый слот без процесса.
Примечание. Скриншот сделан для локального севера, поэтому единственный процесс, который выполняет отправку запроса – это тот, который формирует страницу со статистикой.
Кроме того, если у вас данные постоянно обновляются (используется параметр refresh), то визуально оценить изменения будет очень сложно.
В этом случае удобно использовать скрипт, который будет собирать данные, и показывать их, например, в виде графика.
Можно написать такой его самостоятельно, но проще использовать готовый.
В качестве примера такого скрипта рассмотрим Visualize Apache Server Status (распространяется под LGPL лицензией).
Скрипт состоит из 3-х частей.
1 Конфигурационный файл (inc.config.php). Тут нужно указать адрес страницы со статистикой:
$statusurl = "http://localhost/server-status";
Время обновления данных и масштаб (используется для построения графика).
$refreshtime = 2;

$scalefaktor = 1;
2 Два скрипта (serverstatus.php и serverstatus2.php). Используются для отображения данных. Запускать можно любой из них. Информация одна и та же, только представлена по-разному.
serverstatus.php

serverstatus2.php
3) Класс, выполняющий анализ страницы со статистикой (class.parse_server_status.php). Самый интересный компонент ;). Его можно использовать в собственных скриптах.
При работе вам будут нужны 2 метода этого класса.
1 parse_server_status($url) – в параметре $url задаем адрес страницы со статистикой.
2 getActiveConnections() – возвращает массив с информацией об активных соединениях. На данный момент этот массив содержит: идентификатор процесса, режим работы, время работы процесса, использование CPU, имя виртуального хоста и URI запроса.
Таким образом, несложно написать собственный скрипт, который будет сохранять данные о работе сервера.
Удачи!