
Apache Bench (ab) is a popular HTTP load testing and performance benchmarking tool. It can be used to test the speed of a website’s server. The best way to use Apache Bench is to run it from your local machine, which makes it very easy for beginners or intermediate users who are looking for something accessible. The interface is user-friendly and provides results within one minute of running the program. Apache Bench (AB) gets installed automatically within the Apache web server, or it can be installed separately as an Apache utility by the user. Also, Apache Bench can be used with Asp.NET Core APIs.
In this article, Application Life Cycle Management, Load Testing and HTTP Web Server’s testing need, a tutorial for methodologies of using Apache Bench tool will be told.
What is the Application Life Cycle Management for Apache Bench?
Application Life Cycle is the process of planning, designing, constructing, testing, and launching a product or service. Application Life Cycle is connected to the Apache Bench because Apache Bench can be used for testing the API’s server and usability under heavy HTTP Load. The test section of the Application Life Cycle (ALM) has different tests, such as Unit Test, Functional Test, and Load Test. Apache Bench is used for performing the Load Tests.
Load test is an important step for measuring the endurance of a web server for an application or website. If a website can’t respond to a requestor, it won’t be able to satisfy the users. Thus, a website or any project with a server should perform HTTP Load testing before launching its project. Also, Time to First Byte is a page speed metric that related to the power of the server, thus testing a server with Apache Bench can give an idea to an SEO or developer about the server’s situation compared to competitors.
How to Download Apache Benchmark (AB) Load Testing Tool?
To download and install the Apache Benchmark (AB), the “apt-get” command should be used in Linux and Max operation systems. To download and install the Apache Bench on Windows, the binary zip file should be downloaded from one of the distributors below.
- ApacheHaus
- Apache Lounge
- Bitnami WAMP Stack
- WampServer
- XAMPP
To download the Apache Benchmark with “apt-get” command, you can use the example below.
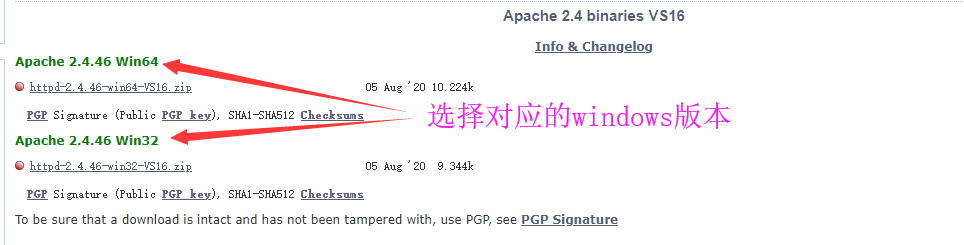
apt-get install apache2-utilsTo download and install the Apache Bench (AB) for windows, you should choose the correct binary zip version and modules for your load testing purposes and device. In this example, you will see an Apache Bench installing process for Windows 64bit, from Apache Lounge.

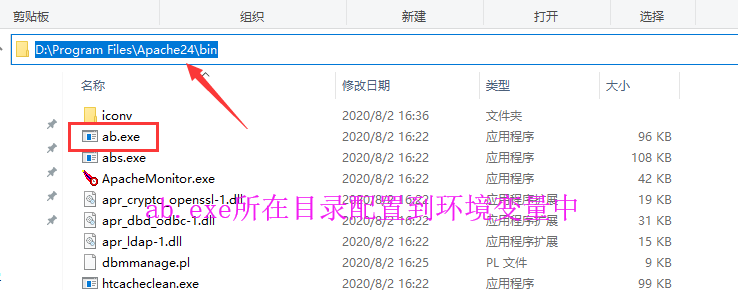
After downloading the “Apache 2.4.47 Win64” file as a zip file, you should extract the file as a folder and open the extracted file to take the “ab.exe” file from the “bin” folder.
Apache Bench can be used via the “ab.exe” file from any folder or path as long as the “ab.exe” file in the specified folder in the command line. In this example, Apache Bench will be used from the desktop by copying the “ab.exe” file.

How to Use Apache Bench for Load Testing?
To use the Apache Bench (ab) the steps below should be followed.
- Change the working directory which includes “ab.exe”.
- Open the command line prompt.
- Use the “ab” command to determine the website to be tested.
- Use -k, -n, -c parameters to determine the load test’s methodology.
An example of usecase for the Apache Bench is below.
ab -k -n 100 -c 10 http://www.holisticseo.digital/
The explanation of the code block is below.
- Used “ab” for the load test.
- Used -k parameter to use the “HTTP KeepAlive Feature”.
- Used -n parameter for the request count.
- Use -c to determine the concurrent request count.
- In this example, we have performed 100 requests in total, and 10 requests per time, we used HTTP KeepAlive Feature” for “holisticseo.digital”.
Below, you will see the result of “Apache Bench” test result.
This is ApacheBench, Version 2.3 <$Revision: 1879490 $>
Copyright 1996 Adam Twiss, Zeus Technology Ltd, http://www.zeustech.net/
Licensed to The Apache Software Foundation, http://www.apache.org/

Benchmarking www.holisticseo.digital (be patient).....done


Server Software:        cloudflare
Server Hostname:        www.holisticseo.digital
Server Port:            80

Document Path:          /
Document Length:        0 bytes

Concurrency Level:      10
Time taken for tests:   2.762 seconds
Complete requests:      100
Failed requests:        0
Non-2xx responses:      100
Keep-Alive requests:    0
Total transferred:      70714 bytes
HTML transferred:       0 bytes
Requests per second:    36.21 [#/sec] (mean)
Time per request:       276.200 [ms] (mean)
Time per request:       27.620 [ms] (mean, across all concurrent requests)
Transfer rate:          25.00 [Kbytes/sec] received

Connection Times (ms)
              min  mean[+/-sd] median   max
Connect:        6   27 141.8      7    1018
Processing:    10  242 390.6     63    1081
Waiting:       10  220 381.8     55    1081
Total:         17  269 406.6     70    1088

Percentage of the requests served within a certain time (ms)
  50%     70
  66%     76
  75%     76
  80%   1071
  90%   1078
  95%   1087
  98%   1087
  99%   1088
 100%   1088 (longest request)
According to the output of the Apache Bench usage example, the time per request was 276 MS, and 36.21 requests performed per second. The max spent time for connecting was 1018 MS, for processing, it was 1081. Simply, we can see the general situation of the webserver for Holisticseo.digital with Apache Bench load test.
Note: To use the Apache Bench load testing tool without an SSL Configuration, you should use “HTTP” instead of “HTTPS”, and a trailing “/” should exist on the URL.
What can be learned from an Apache Bench Load Test?
An Apache Bench load test includes information about the things below.
- Server Software
- Server Hostname
- Server Port
- Document Path
- Document Length
- Concurrency Level for the Apache Test
- Time taken for tests
- Complete requests
- Non-2xx responses
- Keep-Alive requests
- Total transferred
- HTML transferred
- Requests per second
- Time per request
- Time per request for all concurrent requests
- Transfer rate
- Connection Times for Connecting, Processing, Waiting, Total.
- Percentage of the requests served within a certain time (ms)
What are the Parameters that can be used with Apache Bench Tool?
The parameters that can be used for an Apache Bench test and their explanations are below.
- “-A” authorized-user: password: Provides evidence to the server for use in BASIC Authentication. It is simply: put between username and password and is sent to the server base64 encoded over the link, regardless of whether the server needs it (ie, a “401 authentication required” response is not expected).
- “-b” bumper-size: Length of TCP send/receive buffers in bytes.
- “-B” local-address: The address to listen to when making remote connections.
- “-c” connection-count: A number of connections to be processed at the same time. The default value is one connection at a time.
- “-c” connection-count: A number of connections to be processed at the same time. The default value is one connection at a time.
- “-C” cookie-name = value: Cookie: Adds a line to the request. Usually, a name = value pair is used as an argument. These pairs can be more than one.
- “-D”: The message “percentage served within XX [ms] table” is not displayed. (Available for backward compatibility).
- “-e” CSV-file: Comma-separated values (CSV) file showing how much (in percent) of the submitted request was served per unit time (milliseconds). It is naturally more useful than the ‘Gnuplot file as the results are ‘coiled’.
- “-E” client-certificate-file: When connecting to an SSL site, the certificate provided in PEM format is used for authentication with the server. The file is expected to contain the client certificate, intermediate certificates, and private key sequentially. Available in 2.4.36 and later.
- “-f” protocol: SSL/TLS protocol is specified (SSL2, SSL3, TLS1, TLS1.1, TLS1.2 or ALL). Support for TLS1.1 and TLS1.2 is for version 2.4.4 and later.
- “-g” Gnuplot-file: The measured values are written to a ‘Gnuplot or TSV (tab-delimited values) file. This file is considered as a data file by Gnuplot, IDL, Mathematica, Igor, or even Excel. The headers of the data columns are in the first row of the file.
- “-h”: Shows usage information.
- “-H” custom-header: Adds an extra header to the request. The custom header is specified as a name-value pair with a colon between them. Sample: “Accept-Encoding: zip/zop; 8bit”
- “-I”: GETrequests HEADare made instead of requests.
- “-k”: Enables the HTTP KeepAlive (persistent connection) feature, which means multiple requests can be served in a single session. The feature is turned off by default.
- “-l”: If the length of the reply is not fixed, it will not report errors. It can be useful on automata pages. For version 2.4.7 and above.
- “-m” HTTP-method: Specify specific HTTP methods for requests. For 2.4.10 and later versions.
- “-n” requests: The number of requests to apply to the server during the benchmark session. By default, a single request is made with no performance criteria.
- “-p” POST-file: The file containing data about the POST request. Also -T, don’t forget to specify the option. -P proxy-authority, password: Proxy provides evidence to the server for use in BASIC Authentication. It is simply: put between username and password and is sent to the server as base64 encoded over the connection, regardless of whether the proxy needs it (ie without waiting for a “407 proxy authentication required” response).
- “-q”: When the number of requests exceeds 150, it outputs a processed request counter for every 100 or 10% requests, to the standard error. “-q” option ensures that this output is not produced.
- “-r”: Even if the socket gets an error, the program will not exist.
- “-s” timeline: The maximum number of seconds to wait before the socket times out. 30 seconds is the default. For version 2.4.4 and higher.
- “-S”: If there are more than one or two standard deviations between the mean and median values, neither the mean value, the standard deviation value, nor the warning/error messages are displayed. By default, the minimum/average / maximum values are displayed. (Backward compatibility).
- “-t” seconds: It is specified how long the measurement process will be applied. The -n 50000option is applied internally. You can use this to make a comparison over a period of time. By default, there is no time limit.
- “-T” content-type: Content type to be used for POST / PUT data. Example: application / x-www-form-urlencoded. The default value is text/plain.
- “-v” verbosity: The verbosity level of the output is specified. 4and above with information about headings, 3and above with response codes (404, 200, etc.), 2 and above with warning and information messages.
- “-u” PUT-file: The file containing the PUT data. Also, -T don’t forget to specify its option.
- “-V”: Display version information and exit.
- “-w”: Prints result in HTML tables. The default table has a white background and two columns.
- “-x”: attributes: The attributes to be used in the tag are specified. The specified attributes are placed inside the tag in the style.
- “-X”: proxy [: port]: A proxy server is used for requests.
- “-y”: attributes: The attributes to be used in the tag is specified.
- “-Z”: password-cluster: The SSL / TLS cipher set is specified (see OpenSSL (1) passwords).
How to Print an Apache Bench Load Test Result?
There are two different methodologies for taking the output of the Apache Bench load test as a file.
- HTML Table Output with “-w” parameter.
- Gnuplot Output with “-g” parameter.
How to Output Apache Bench Result Load Test to a File as HTML Table?
To print a Apache Bench Load test result as HTML Table, the “-W” parameter should be used. An eaxmple of printing Apache Bench load test result is below.
ab -k -n 100 -c 10 -w http://www.holisticseo.digital/The “-w” parameter here will print all the output as a HTML Table with raw codes.

The printed HTML Table output should be taken to an HTML editor to see the results in a clear way. Below, you will see the printed HTML Table output for the Apache Bench Load test.

How to Print out an Apache Bench Load Test Result as GNUPLOT and Text File?
To print out an Apache Bench (ab) load test results as a txt file and gnuplot, the “-g” parameter and the file name should be used. Below, you can see an example of Apache Bench load test result as txt file and gnuplot.
ab -k -n 100 -c 10 -g output.txt http://www.holisticseo.digital/In the current working directory, you will see an output file as “output.txt”.
Below, you will see the output file’s content for the Apache Bench test.

In the Apache Bench load test result as a text file, you can see the request date, and response times. On the other hand, Gnuplot is a data visualization programming language, and a “Gnuplot” file can be used to visualize the Apache Bench test results.
Apache Bench Usage Example for Facebook Load Test
An example test with the 100 concurrent requests from 10 virtual users at the same time by keeping the HTTP Connection alive for Facebook with Apache Bench Load Testing is below.
ab -k -n 100 -c 10 -w http://www.facebook.com/You can see the Apache Bench test tool usage example’s output for Facebook below.
| Server Software: | |||
|---|---|---|---|
| Server Hostname: | www.facebook.com | ||
| Server Port: | 80 | ||
| Document Path: | / | ||
| Document Length: | 0 bytes | ||
| Concurrency Level: | 10 | ||
| Time taken for tests: | 0.960 seconds | ||
| Complete requests: | 100 | ||
| Failed requests: | 0 | ||
| Non-2xx responses: | 100 | ||
| Keep-Alive requests: | 100 | ||
| Total transferred: | 37965 bytes | ||
| HTML transferred: | 0 bytes | ||
| Requests per second: | 104.16 | ||
| Transfer rate: | 38.62 kb/s received | ||
| Connection Times (ms) | |||
| min | avg | max | |
| Connect: | 0 | 1 | 16 |
| Processing: | 62 | 77 | 217 |
| Total: | 62 | 78 | 233 |
Apache Bench Usage Example for Twitter Load Test
An example test with the 100 concurrent requests from 10 virtual users at the same time by keeping the HTTP Connection alive for Twitter with Apache Bench Load Testing is below.
ab -k -n 100 -c 10 -w http://www.twitter.com/You can see the Apache Bench test tool usage example’s output for Twitter below.
| Server Software: | tsa_o | ||
|---|---|---|---|
| Server Hostname: | www.twitter.com | ||
| Server Port: | 80 | ||
| Document Path: | / | ||
| Document Length: | 0 bytes | ||
| Concurrency Level: | 10 | ||
| Time taken for tests: | 2.460 seconds | ||
| Complete requests: | 100 | ||
| Failed requests: | 0 | ||
| Non-2xx responses: | 100 | ||
| Keep-Alive requests: | 100 | ||
| Total transferred: | 62200 bytes | ||
| HTML transferred: | 0 bytes | ||
| Requests per second: | 40.65 | ||
| Transfer rate: | 24.69 kb/s received | ||
| Connection Times (ms) | |||
| min | avg | max | |
| Connect: | 0 | 6 | 62 |
| Processing: | 162 | 185 | 724 |
| Total: | 162 | 191 | 786 |
Apache Bench Usage Example for Google Load Test
An example test with the 100 concurrent requests from 10 virtual users at the same time by keeping the HTTP Connection alive for Google with Apache Bench Load Testing is below.
ab -k -n 100 -c 10 -w http://www.google.com/You can see the Apache Bench test tool usage example’s output for Twitter below.
| Server Software: | gws | ||
|---|---|---|---|
| Server Hostname: | www.google.com | ||
| Server Port: | 80 | ||
| Document Path: | / | ||
| Document Length: | 13640 bytes | ||
| Concurrency Level: | 10 | ||
| Time taken for tests: | 5.791 seconds | ||
| Complete requests: | 100 | ||
| Failed requests: | 99 | ||
| (Connect: 0, Length: 99, Exceptions: 0) | |||
| Keep-Alive requests: | 0 | ||
| Total transferred: | 1434874 bytes | ||
| HTML transferred: | 1364474 bytes | ||
| Requests per second: | 17.27 | ||
| Transfer rate: | 241.97 kb/s received | ||
| Connection Times (ms) | |||
| min | avg | max | |
| Connect: | 34 | 55 | 1050 |
| Processing: | 106 | 489 | 324 |
| Total: | 140 | 544 | 1374 |
What are the other Methods for Load Tests?
The load test methods are listed below.
| Tool name | Company name | License | Type | Pricing | Focus | Notes |
|---|---|---|---|---|---|---|
| Apache JMeter | An Apache Jakarta open source project | Apache License 2.0 | Local | Free | This Java program allows performance measurement and load testing. | |
| BlazeMeter | BlazeMeter Ltd. | Proprietary | Cloud based | Free plan available | There are many scenarios including websites, mobile apps, databases, etc. | It can emulate browser users from eight geographical locations at once, enabling 200,000 simultaneous loadings. It can also be used to test integrations and functionalities. |
| Blitz | Spirent Communications | Proprietary | Cloud based | Trial available | Websites, mobile and REST APIs | The system allows for the simulation of up to 50,000 simultaneous users from across the globe. |
| Flood | Tricentis Corp. | Proprietary | Cloud based | Free usage tier, paid usage tiers | Applications based on APIs, protocols, and browser-based load testing | On-premises and on AWS with scalability to millions of concurrent users from all geographies. Pricing is determined by Virtual User Hours consumed each month. |
| Gatling | Open Source | Apache License 2.0 | Local | Free | Java web applications | HTML reports can be easily accessed on a mobile device. |
| Loader.io | SendGrid Labs | Proprietary | Cloud based | Free plan available | Web applications and API | |
| LoadRunner | Micro Focus | Proprietary | Local | Trial available | This framework is most commonly used for testing large numbers of tests (or a large number of virtual users), though unit and integration testing can also be conducted using this framework. | |
| Load Test (included with SOAtest) | Parasoft | Proprietary | Local | Demo available | Performance testing software designed to verify the functionality of software under load. Supports SOAtest tests, JUnits, lightweight socket-based components. Detects concurrency issues. | |
| loadUI | SmartBear Software | EUPL | Local | Demo available | Tests web services on a variety of platforms and integrate with soapUI. | |
| Login VSI | Login VSI, Inc. | Proprietary | Local | Trial available | Windows desktop workloads on virtual machines | |
| NeoLoad | Neotys | Proprietary | Local | Free plan available | Web and mobile | There are local agents as well as cloud agents that generate the load. |
| OpenSTA | Open System Testing Architecture | GNU General Public License 2.0 | Local | Free | Web server | OpenSTA binaries are available for Windows. Developed on the basis of CORBA. |
| Rational Performance Tester | IBM | Proprietary | Local | Trial available | Eclipse-based performance test tool primarily used to execute large-scale tests on server-based applications. | |
| Siege | Open source | Open source GPLv3 or later | Local | Free | Web servers | HTTP, HTTPS, and FTP protocols are supported as well as basic authentication and cookies. |
| Silk Performer | Borland | Proprietary | Local | Trial available | Licensed application performance monitoring tool with local and cloud virtual agents that support most protocols. | |
| Test Studio | Telerik | Proprietary | Local | Trial available | Analyze how the site would perform at high volume when many people visit it at once. | |
| Visual Studio Enterprise edition | Microsoft | Proprietary | Local | Trial available | Visual Studio Enterprise edition includes a load test tool that enables developers to execute a variety of tests (web, unit, etc) under real-world conditions. However, Microsoft announced that their web performance and load testing functionality would be deprecated after Visual Studio 2019. | |
| WebLOAD | RadView | Proprietary | Cloud based or Local | Free plan available | Application programming interfaces for mobile and web | Load testing tools for web and mobile applications. Includes Web Dashboards for performance testing analysis. Can be used to generate loads from the cloud as well. Licensed. |
Load Test methods for web servers beside Apache Bench are listed above. Silk Performer, Test Studio, WebLoad, BlazeMeter, and Apache JMeter are the most used Load Test technologies and software.
How to Perform Load Test with Python?
To perform a load test for a webserver the locust Python library can be used.

To perform a load test with Python’s Locust library, the code block below can be used.
from locust import HttpUser, between, task


class WebsiteUser(HttpUser):
    wait_time = between(5, 15)

    def on_start(self):
        self.client.post("/login", {
            "username": "test_user",
            "password": ""
        })

    @task
    def index(self):
        self.client.get("/")
        self.client.get("/static/assets.js")

    @task
    def about(self):
        self.client.get("/about/")
Then, the written code block should be called and worked from the command line prompt. In the future, there will be a more detailed guide for load tests for web servers with Python. The difference between the load test with Apache Bench and Python is that using Apache Bench for load test is still faster than Locust, but with Locust having a graphical user interface and configuring the load test in a more detailed way is possible.
Last Thoughts on Web Server Load Tests with Apache Bench and Holistic SEO
Load tests for web servers are important for SEO, User Experience, and web page loading performance optimization, along with web security. A strong server will let users load the necessary resources for the web pages faster, it will be able to open more concurrent connections to serve the users. Apache Bench Load Testing tool can be used to perform load tests for web servers and websites to compare their back-end infrastructures and technologies. A strong server can respond faster to the Search Engine Crawlers such as Googlebot, Bingbot, or Yandexbot. Thus, a load test and its results can show SEOs which websites have a better server, and what can be improved.
Shared Servers, Visual Private Servers, Dedicated Private Servers have different response times and load capacity. And, for SEO Performance, a shared server (hosting) or a private hosting (server) can affect the SEO performance, crawl success rate, and user experience. Thus, testing a website’s server in terms of responsiveness, load capacity, and response speed is important for SEO, UX, and page speed. A Holistic SEO can use Apache Bench to perform load tests for websites and their competitors to have an insight into the server statuses.
Crawl stats, response status codes, and log analysis can be used to understand a web server’s communication with a search engine. A fast crawlable website with a strong server is a fundamental need for SEO Performance. Our Apache Bench load testing tutorial will be updated in light of new information over time.
- Author
- Recent Posts
Owner and Founder at Holistic SEO & Digital
Koray Tuğberk GÜBÜR is the CEO and Founder of Holistic SEO & Digital where he provides SEO Consultancy, Web Development, Data Science, Web Design, and Search Engine Optimization services with strategic leadership for the agency’s SEO Client Projects. Koray Tuğberk GÜBÜR performs SEO A/B Tests regularly to understand the Google, Microsoft Bing, and Yandex like search engines’ algorithms, and internal agenda. Koray uses Data Science to understand the custom click curves and baby search engine algorithms’ decision trees. Tuğberk used many websites for writing different SEO Case Studies. He published more than 10 SEO Case Studies with 20+ websites to explain the search engines. Koray Tuğberk started his SEO Career in 2015 in the casino industry and moved into the white-hat SEO industry. Koray worked with more than 700 companies for their SEO Projects since 2015. Koray used SEO to improve the user experience, and conversion rate along with brand awareness of the online businesses from different verticals such as retail, e-commerce, affiliate, and b2b, or b2c websites. He enjoys examining websites, algorithms, and search engines.
Installation instructions for ‘ab’ and ‘hey’ for both Mac and Windows.
Load Testing Tools Installation Guide
This guide provides installation instructions for two load-testing tools: Apache Benchmark (ab) and hey. These tools can be used to generate high HTTP request loads on a server or load balancer.
Apache Benchmark (ab)
Mac (via Homebrew)
- Open Terminal and run:
- Verify the installation:
Windows (via Chocolatey)
- Open PowerShell as Administrator.
- Run:
choco install apache-httpd -y
- Close and reopen PowerShell, then verify:
Windows (Manual Installation)
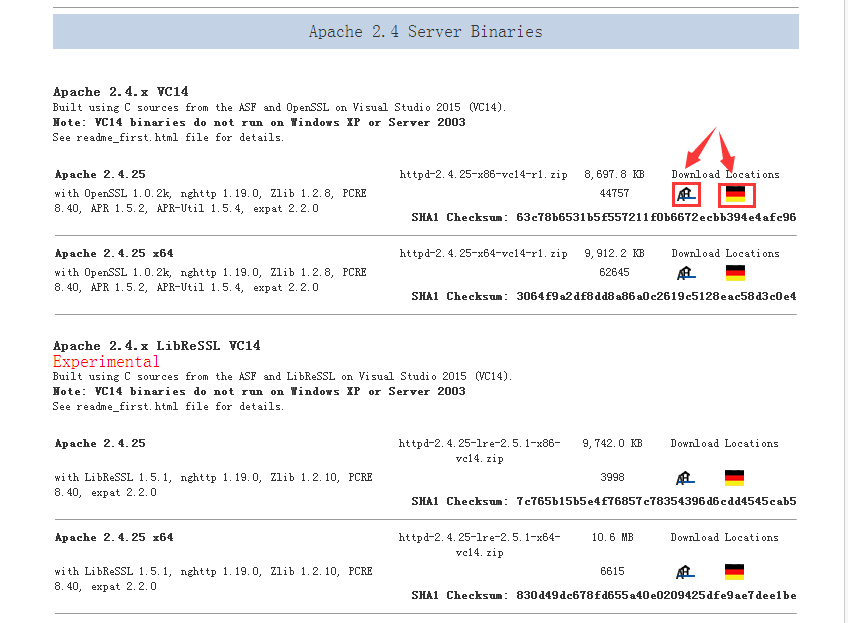
- Download Apache HTTP Server from:
https://www.apachelounge.com/download/ - Extract it to
C:\Apache24(or another location). - Add the
binfolder to the System Path:- Open System Properties → Environment Variables.
- Edit the
Pathvariable under System variables. - Add:
C:\Apache24\bin
- Restart the terminal and verify:
hey (Go-based Load Tester)
Mac (via Homebrew)
- Open Terminal and run:
- Verify the installation:
Windows (via Chocolatey)
- Open PowerShell as Administrator.
- Run:
- Verify the installation:
Windows (Manual Installation)
- Download the latest Windows binary from:
https://github.com/rakyll/hey/releases - Extract the
.exefile toC:\hey\. - Add
C:\hey\to your System Path:- Open System Properties → Environment Variables.
- Edit the
Pathvariable under System variables. - Add:
C:\hey\
- Restart the terminal and verify:
Running Load Tests
Once installed, you can run a test against your load balancer or web server:
Using Apache Benchmark (ab):
ab -n 500000 -c 500 http://your-load-balancer-dns-name/
Using hey:
hey -z 5m -q 1000 -c 500 http://your-load-balancer-dns-name/
Replace your-load-balancer-dns-name with the actual DNS or public IP of the target server.
Need Help?
If you encounter any issues, feel free to reach out!
Download and use of Apache benchmark in windows environment
tags: # Performance Testing software test
Apache benchmark is software written in C language, so if you want to use Windows, one way is to build your own compilation environment and then compile
There is another way to directly use the compiled software. The link below is the compiled download page provided by the official.
Compiled ab download page
Unzip after downloading
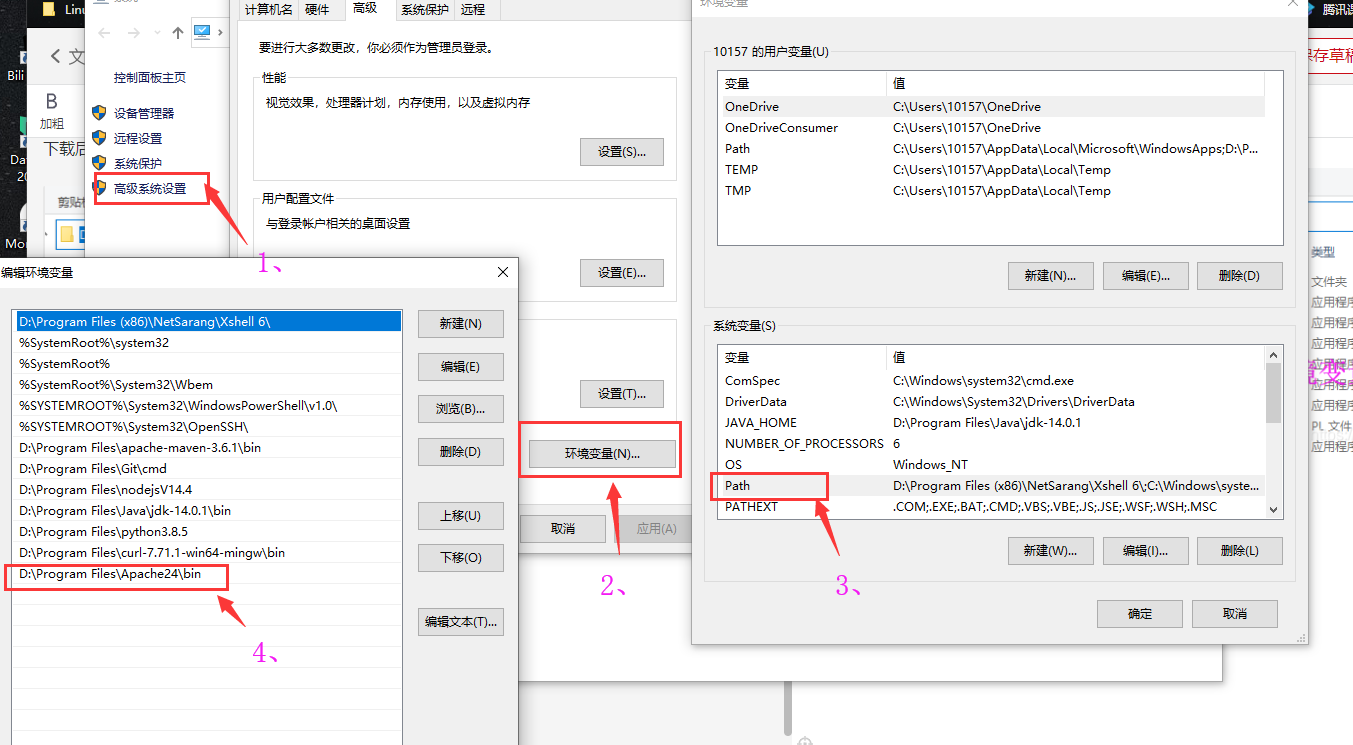
this computer —right click —> properties
Then add the following sequence to the environment variables
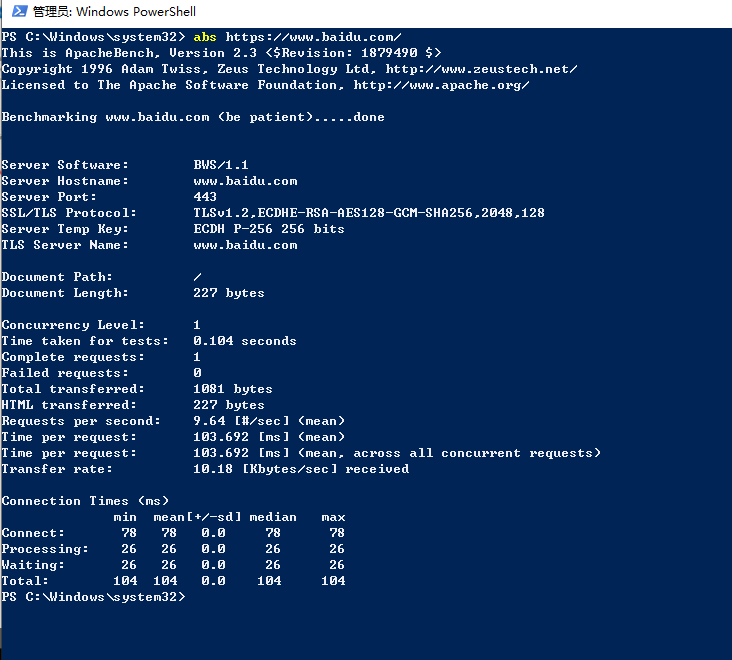
https protocol needs to be usedabs
http protocol can be usedaborabs
Intelligent Recommendation

Download and install Apache for Windows
PHP runs inevitable and ultimately support server, what is the server? Popular talk is on a computer, install a server software, this computer will be able to call the server operating system, server …
Windows tomcat and apache environment
First install apache and tomcat, as well as JDK. My version is apache2.2.17, tomcat 6.0.18, jdk1.6.0_02. 1. Create two files workers.properties and mod_jk.conf under Apache conf (the file name can be …
More Recommendation
Windows version of apache server download
Personal download software like to download from the official website, but unfortunately the apache official website does not provide the windos version to download, the following is the original text…
apache benchmark(ab)
Basic usage of ab The total number of transmission request Test: n c: the amount of the number of concurrent requests, i.e., emitted at one time Address: ip domain name or web application server. Port…
The ab command also known as ApacheBench is a command line benchmarking tool for testing the amount of time it takes your server to respond to HTTP requests. You can use this information to determine the estimated number of simultaneous requests your Apache HTTP server can handle before it begins to degrade the overall performance.
In this guide, we’ll explain what ab is and how to use it, then perform a case study to show you how to stress test your website with ab.
- What is ab (AbacheBench)?
- How Do I Use ab?
- Running Your First Benchmark Test
- Reviewing the Test Results
- What Effect Does ab Have on my Server?
- Stress Testing Sites – Case Study
- Troubleshooting
- Beware – Only Test Sites That You Own
What is ab (ApacheBench)?
ApacheBench is used by website managers and system administrators to pressure test sites/servers and identify the limits of the environment. It is run by using the ab command and it is used to test the ability of a web server to handle a large number of HTTP requests at the same time.
Requests can be sent “concurrently” meaning they run at the same time. You can also set the requests to stay open (HTTP KeepAlive) which puts an increasingly larger amount of stress on your environment. This simulates a heavy load of traffic to your server by slamming it with simultaneous requests.
This will then provide an output that lists how long in milliseconds it takes the server to respond to the requests while under an increasing amount of usage. You can then use this data to determine if your site/web application is capable of managing the predicted load. If it is not able to continue responding within a reasonable amount of time it indicates that you may need to upgrade your Apache HTTP server.
How Do I Use ab?
You can run ab directly from a server or even your local computer. We recommend using a separate server from the one you are testing so it does not interfere with the testing process.
To view the basic usage and options for the ab command by running the help command.
ab -help
This will provide the following information:
Usage: ab [options] [http[s]://]hostname[:port]/path
Options are:
    -n requests     Number of requests to perform
    -c concurrency  Number of multiple requests to make at a time
    -t timelimit    Seconds to max. to spend on benchmarking
                    This implies -n 50000
    -s timeout      Seconds to max. wait for each response
                    Default is 30 seconds
    -b windowsize   Size of TCP send/receive buffer, in bytes
    -B address      Address to bind to when making outgoing connections
    -p postfile     File containing data to POST. Remember also to set -T
    -u putfile      File containing data to PUT. Remember also to set -T
    -T content-type Content-type header to use for POST/PUT data, eg.
                    'application/x-www-form-urlencoded'
                    Default is 'text/plain'
    -v verbosity    How much troubleshooting info to print
    -w              Print out results in HTML tables
    -i              Use HEAD instead of GET
    -x attributes   String to insert as table attributes
    -y attributes   String to insert as tr attributes
    -z attributes   String to insert as td or th attributes
    -C attribute    Add cookie, eg. 'Apache=1234'. (repeatable)
    -H attribute    Add Arbitrary header line, eg. 'Accept-Encoding: gzip'
                    Inserted after all normal header lines. (repeatable)
    -A attribute    Add Basic WWW Authentication, the attributes
                    are a colon separated username and password.
    -P attribute    Add Basic Proxy Authentication, the attributes
                    are a colon separated username and password.
    -X proxy:port   Proxyserver and port number to use
    -V              Print version number and exit
    -k              Use HTTP KeepAlive feature
    -d              Do not show percentiles served table.
    -S              Do not show confidence estimators and warnings.
    -q              Do not show progress when doing more than 150 requests
    -l              Accept variable document length (use this for dynamic pages)
    -g filename     Output collected data to gnuplot format file.
    -e filename     Output CSV file with percentages served
    -r              Don't exit on socket receive errors.
    -m method       Method name
    -h              Display usage information (this message)
    -I              Disable TLS Server Name Indication (SNI) extension
    -Z ciphersuite  Specify SSL/TLS cipher suite (See openssl ciphers)
    -f protocol     Specify SSL/TLS protocol
                    (SSL2, TLS1, TLS1.1, TLS1.2 or ALL)
    -E certfile     Specify optional client certificate chain and private key
For more detailed information you can view the command manual.
man ab
Install ab on Windows 10
- Go to apachelounge.com, download and extract the latest version of Apache, then extract it.
- Search in your taskbar for Control Panel then click it.
- Click System and Security then System.
- On the right click Advanced System Settings then click the Advanced tab (if you are not already there).
- Click the Environmental Variables… button.
- Under System Variables double click the Path variable.
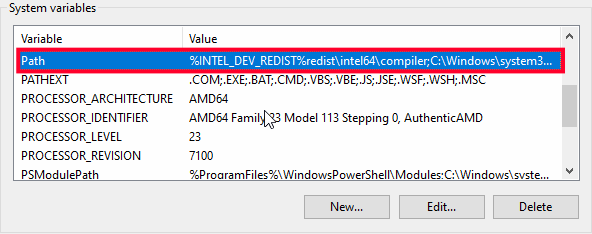
- Click the New button then Browse.
- Navigate to the /Apache24/bin folder that you downloaded and extracted then click OK, OK, and OK to close the windows and save the new system variable.

- Open a new command prompt (windows key->cmd) then you can use the ab command.

Install ab Linux
- With Ubuntu and or Mint you can install ab with the following command:
sudo apt install apache2-utils
- Type your password then click the Enter key.
- Click the y then Enter key to continue. The ab tool will then be installed.
Install ab on Mac
ApacheBench is installed on Mac computers by default and should not require any additional installation before it can be used.
Running Your First Benchmark Tests
To begin, connect to your server via SSH and run one of the following commands.
Basic ab Test
First, we will run a basic test with the -n option, which will allow you to choose how many requests you want to send. Without adding this option it will only send one single request. Run the following command to send 10 individual requests, which should not be difficult for your server to handle. But this can be a good starting point for comparing later results.
ab -n 10 "https://example.com"
Increase the Number of Requests Sent
Now that you know how to run a basic test, you can increase the number of requests that are sent. In this example, we will send 500 requests but you can increase the number as needed to compare results.
ab -n 500 "https://exampletestsite.com/site
Increase the Number of Concurrent Requests
Next, we will add the -c option to make the requests concurrent, which means they will run at the same time. In this example, we will send 500 requests with 50 being sent simultaneously at a time.
ab -n 500 -c 50 "https://example.com/"
Performing a Persistent ab Test (KeepAlive)
The -k option adds a KeepAlive header allowing the server to keep the connection open so it can be used again.
ab -n 10000 -c 1000 -k "https://example.com/"
Output ab Test to a File
Use the -g option if you want to save the test results to review later or prefer to read them in a text file. In this example, I’m going to save them to a file called test.txt.
ab -n 100 -c 50 -k -g test.txt "https://example.com/"
You can then review the file using an editor such as nano or vi by running one of the following commands.
View the ab Test Results File With nano
nano test.txt
Exit nano by clicking Ctrl+X
View the ab Test Results File With vi
vi test.txt
Exit vi by typing :q! then clicking Enter.
Reviewing the Test Results
While running these tests, ab will list how many requests are completed then how many finished. It will then provide a summary that looks like this.
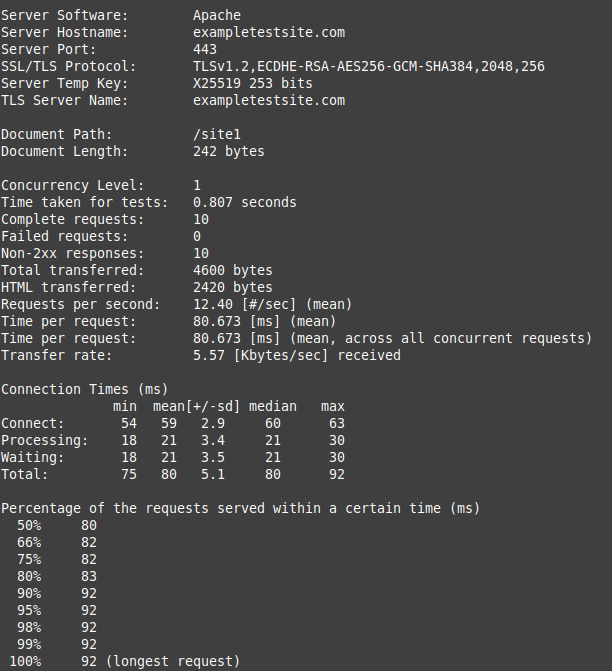
You can review the results and determine how your server performed. We will now go over some of the data that the ab test will provide.
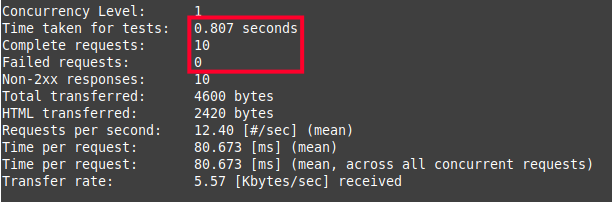
Time taken for tests/Complete requests/Failed requests
Requests per second/Time per request/Transfer rate
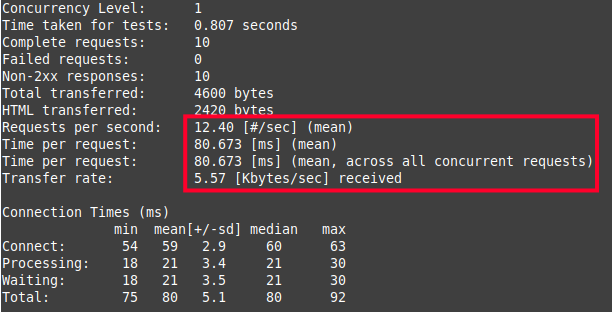
Connection Times
For this section, I will typically look at the Total minimum (fastest response) and the Total max (longest response).
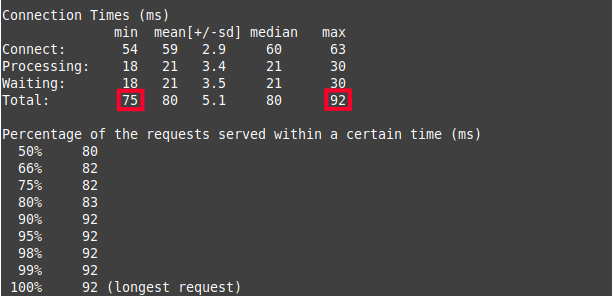
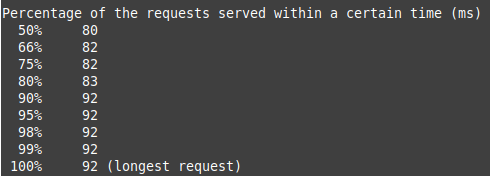
Percentage of the requests server within a certain time (ms)
This data can help you determine the number of requests your server can respond to before the performance begins to degrade. For example, if you perform a test and notice a spike in time at 90% of your total requests, this indicates that may be near the limit of what it can handle.
What Effect Does ab Have on my Server?
If you want to monitor the amount of stress these ab tests are putting on your server, you can run a command such as top or htop to monitor your server’s performance and see how much of your resources are being utilized by the process.
Monitor CPU Usage
We will now show you how to monitor your server usage with the top and htop commands.
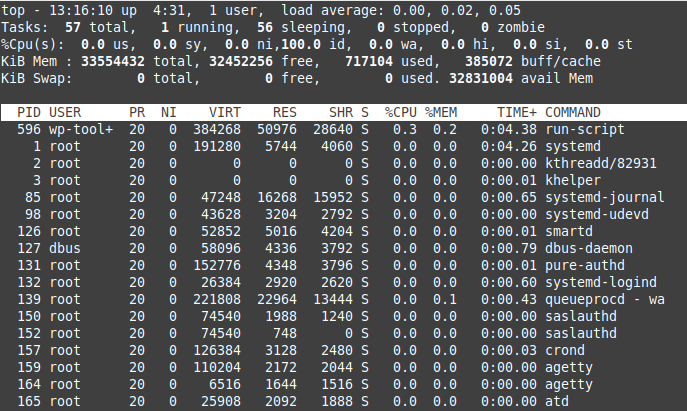
Monitor With top
- Login to your server via SSH.
- Run the following command
top
You should then see realtime results similar to this.

Monitor With htop
Some may prefer to use the htop command since it provides a more robust visual breakdown of the computer’s resource usage.
- You may have to install htop by running the following command, click the y key, then Enter.
sudo yum install htop
- Run the following command.
htop
You will then be able to monitor your server’s resource usage in realtime and it will look similar to this.

Stress Testing Sites – Case study
For this case study, I will be creating three different websites and then performing the same ab test on them so we can compare results. These sites are all hosted on a VPS Hosting plan from InMotion. The first site will be a blank WordPress site, the second site will be WordPress with a BoldGrid Inspiration installed, and the final site will be the same Boldgrid Inspiration site with W3 Total Cache Installed.
The following is the ab command we’ll use on all three sites.
ab -n 100000 -c 500 -k "https://example.com"
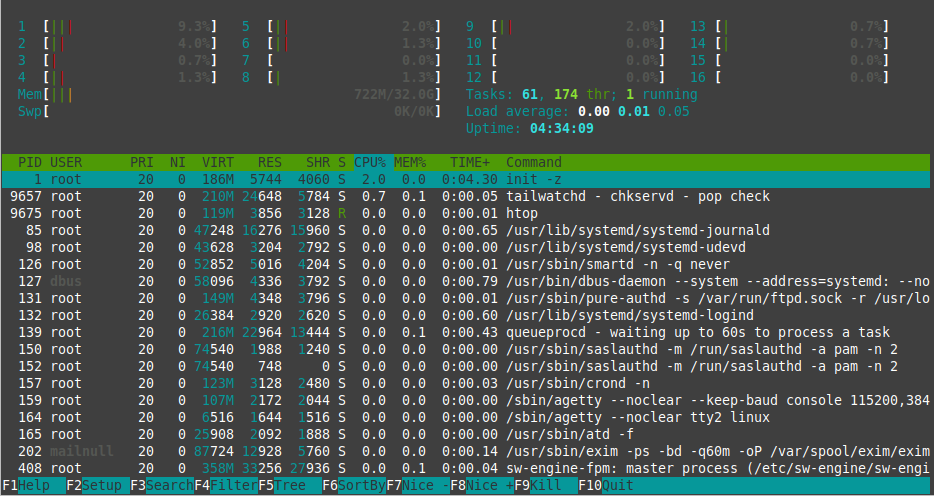
Before we get started I’m going to run the htop command so we can see how the server is performing before we begin testing. There’s not a lot of CPU or memory being utilized on this server.
Blank WordPress Site
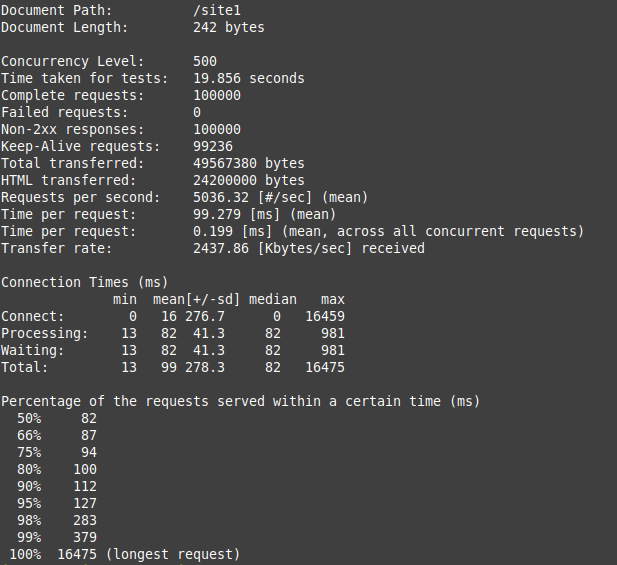
This first test is on a clean WordPress installation with no caching setup.
Test #1 Results
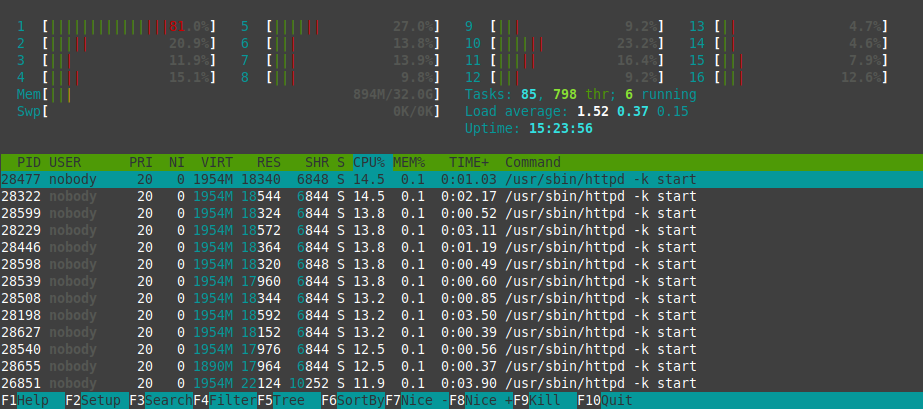
Here are the results of running htop during the test. Notice how the CPU, memory, and Load average increase from the initial test we shared earlier.
WordPress Site With BoldGrid Inspirations Installed
The second site we are testing is a new site with only a BoldGrid Inspiration installed.
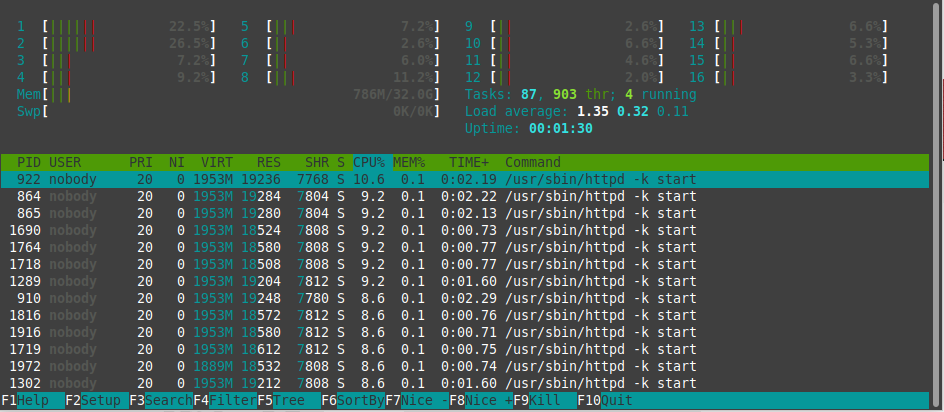
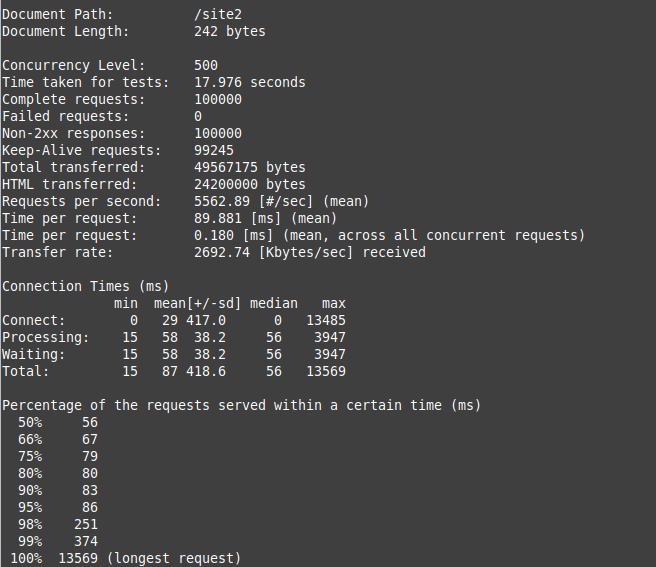
Test #2 Results
With the second site, the test was completed a second faster. Also notice that it completed 526.57 more requests per second on average. Also the longest request took 13 seconds as opposed to 16 with the first test.
Here are the results of running htop during the second test. Here we see that the CPU and load average have spiked considerably but it was still able to complete the test without any failures.
WordPress Site With BoldGrid Inspirations & W3 Total Cache Installed
Finally, we’ll test the same site from Test #2, but with W3 Total Cache Installed.
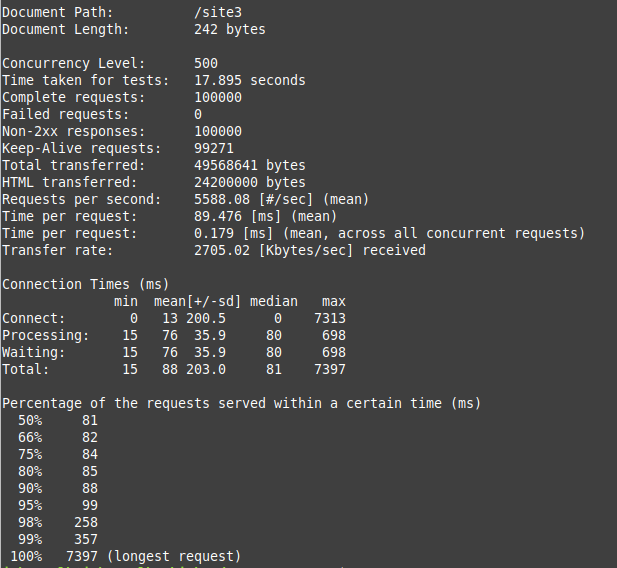
Test #3 Results
With the final test W3 total cache seems to help serve the requests faster, resulting in 25 more average requests per second and also no failed requests. What really stands out is that the longest request only took 7 seconds as opposed to 16 (Test #1) and 13 (Test #2).
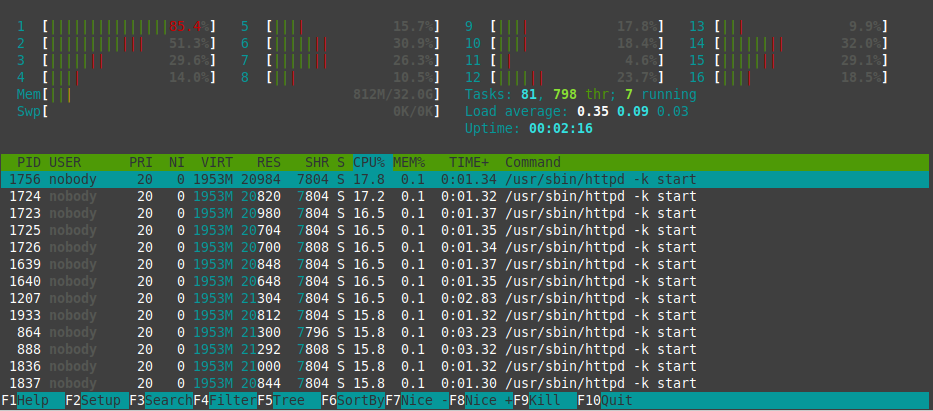
You can also see this lighter load average reflected when we run htop, even though the CPU usage spiked.
Comparing the Results
Here is a graph of the test results comparing the blank site, Inspiration Site, and Inspiration Site with W3 Total Cache installed.
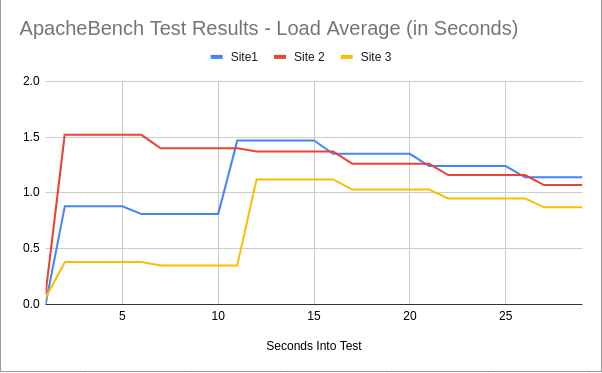
Notice how the load on the site using W3 Total Cache does not spike as high overall, while the first and second site results are relatively similar. This provides further evidence that caching can help reduce the amount of load on your server. So, even if a strong server can handle a large number of requests, when you use caching it can reduce the level of resources being used.
Troubleshooting
Too many open files (24)
When I increased the concurrency too high, it often results in this error. I then reduced the concurrency level incrementally until the test was able to complete successfully.
SSL handshake failed (5)
This error seemed to occur later in the day when the server was possibly busier and handling other typical tasks. In this case, I reviewed the tasks using htop and was able to determine there was a spam filter and backups running as well causing several of my requests to fail, even though the ab test completed.
Beware – Only Test Sites That You Own
Congratulations, now you know how to stress test your website with ApacheBench (ab)! We also recommend bookmarking our full guide on How to Stress Test Your Website / Top 3 Load Testing Tools.
I recently had the need to carry out load testing on some endpoints that I created for a project on my Windows OS. Setting this up was part of a herculean task because most tutorials were done on an Ubuntu machine.
What is Load Testing
Load Testing is a type of performance testing that gives you insight into how your web application or HTTP server would react when more demand is placed on it.
For this article, we will focus on testing an HTTP server using Apache Benchmark on a Windows OS.
Requirements
- Vs-code
- Apache Benchmark
Installing Apache Benchmark
The latest version of Apache Benchmark for windows can be installed here

Move into the Apache24/bin directory and copy both the ab and abs executable files to your project directory (optional).

Making a GET request to our server
Run the following command in your terminal, in the directory where your ab and abs executable files are located:
./ab -c 10 -n 20 http://localhost:8080/
Enter fullscreen mode
Exit fullscreen mode
-
-cConcurrency
This indicates the number of multiple requests to make at a time. For this test, we are sending 10 requests to our server concurrently at the same time. -
-nRequest
This indicates the number of requests to perform.
More of this flags and there descriptions can be found in the Apache Benchmark site
For this test, below is our expected response.
this is ApacheBench, Version 2.3 <$Revision: 1903618 $>
Copyright 1996 Adam Twiss, Zeus Technology Ltd, http://www.zeustech.net/
Licensed to The Apache Software Foundation, http://www.apache.org/

Benchmarking localhost (be patient).....done


Server Software:
Server Hostname:        localhost
Server Port:            8080

Document Path:          /
Document Length:        23 bytes

Concurrency Level:      10
Time taken for tests:   0.033 seconds
Complete requests:      20
Failed requests:        0
Total transferred:      19240 bytes
HTML transferred:       460 bytes
Requests per second:    606.58 [#/sec] (mean)
Time per request:       16.486 [ms] (mean)
Time per request:       1.649 [ms] (mean, across all concurrent requests)
Transfer rate:          569.85 [Kbytes/sec] received

Connection Times (ms)
              min  mean[+/-sd] median   max
Connect:        0    0   0.4      0       1
Processing:     3   12   3.9     13      18
Waiting:        2   10   4.0     10      17
Total:          3   13   3.8     13      18

Percentage of the requests served within a certain time (ms)
  50%     13
  66%     15
  75%     16
  80%     17
  90%     17
  95%     18
  98%     18
  99%     18
 100%     18 (longest request)
Enter fullscreen mode
Exit fullscreen mode
This provides a detailed insight into how our server performs when 10 concurrent requests are sent. It shows the amount of time it takes to process a certain percentage of our requests and provides in-depth analysis of our server’s performance.
Making a POST request to our server using Apache Benchmark
When making a POST request that requires a request body, we need to pass the data to our benchmark request. This is done by creating a .txt file that should contain our request body data. The file should be in the same location as our ab and abs executable files.
For this test, I created a post.txt file that contains a JSON object representing our request body.
The request body should be in one line with no extra end-of-line spaces.
TIP: To place data in one line on VS Code, select the whole content and use this command CTRL + SHIFT + J.

Proceed to run the following line of command in your terminal.
./ab -p post.txt -T application/json -c 5 -n 5 http://localhost:8080/v1/product
Enter fullscreen mode
Exit fullscreen mode
-
-pPost File
This indicates the file containing data to POST. -
-tContent Type
Content-type header to use for POST/PUT data, eg. application/x-www-form-urlencoded. Default is text/plain.
To test a server that requires an authentication header with Apache benchmark, the following command can be used:
ab -p post.txt -T application/json -H 'Authorization: Token abcdbdhbuhfrhv' -c 10 -n 200 http://localhost:8080/v1/product
Enter fullscreen mode
Exit fullscreen mode
-
-HCustom header —
This appends extra headers to the request. The argument is typically in the form of a valid header line, containing a colon-separated field-value pair (i.e., «Accept-Encoding: zip/zop;8bit»).
Note: Apache Bench only uses one OS thread irrespective of the concurrency level (specified by the -c flag). Therefore, when benchmarking high-capacity servers, a single instance of Apache Bench can be a bottleneck. To completely saturate the target URL, use additional instances of Apache Bench in parallel (if your server has multiple processor cores).
Don’t forget to like, share and let me know if you found this helpful.