
Если вы подозреваете, что встроенный Windows Defender Firewall блокирует некоторые сетевые подключений (от определенной программы или сервиса), плохим решением будет его полное отключение. Вместо этого вы можете включить логирование сетевого трафика, проходящего через брандмауэр, определить заблокированные используемые порты и/или IP адреса источника/назначения и создать корректное разрешающее правило.
В этой статье мы покажем, как включить логирование сетевых подключений в Windows Firewall и выполнить поиск по логам.
Настройка логирования Windows Firewall в текстовый файл
Содержание:
- Запись логов Windows Firewall в журнал событий Windows
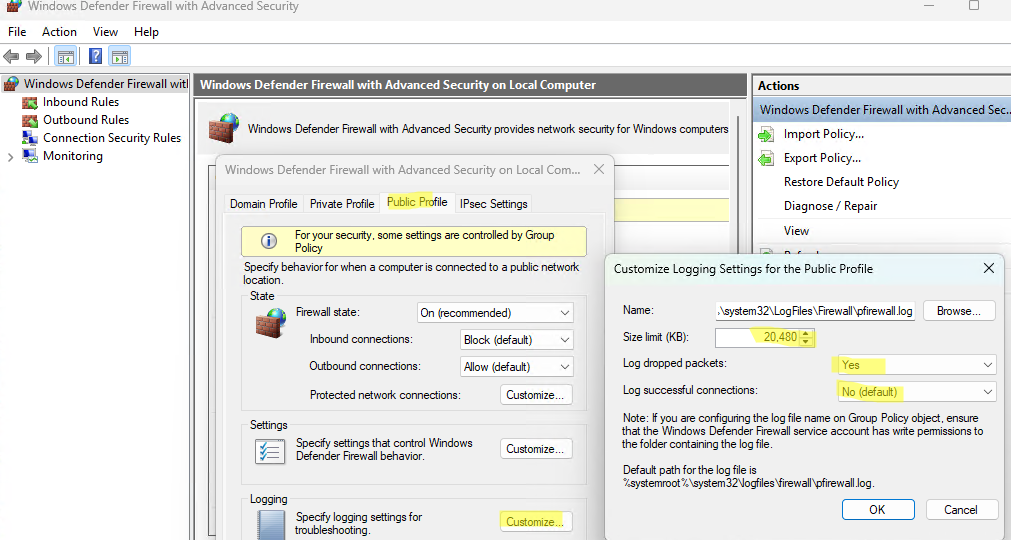
Windows Defender Firewall позволяет записывать в лог файл как успешные так и заблокированные сетевые подключения. Логирование можно включить отдельно для каждого сетевого профиля (частная, общедоступная или доменная сеть). По умолчанию логирование трафика в брандмауэре отключено. Чтобы включить ведение логов в Windows Firewall:
- Откройте MMC оснастку Windows Firewall with Advanced Security (
wf.msc
). - Щелкните правой кнопкой по корню консоли и выберите Properties;
- Затем выберите вкладку сетевого профиля Windows, для которого вы хотите включить логирование (Domain, Private или Public Profile).
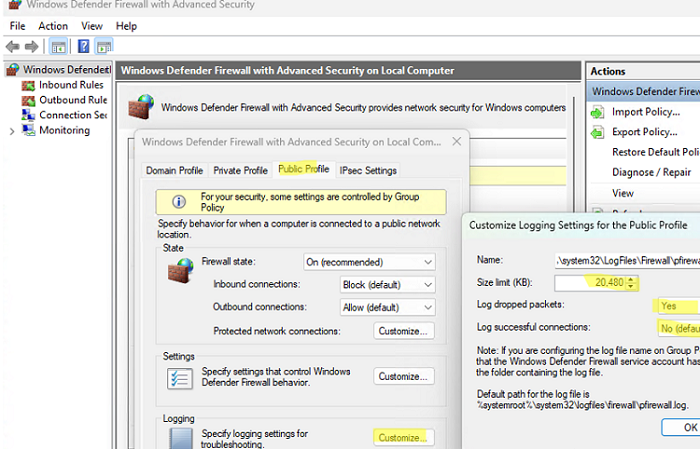
- На вкладке профиля в секции Logging нажмите кнопку Customize.
- Здесь можно изменить следующие настройки:
Файл лога: по умолчанию
%systemroot%\system32\LogFiles\Firewall\pfirewall.logМаксимальный размер лога: увеличьте с 4 Мб до 20 Мб (
20480
Кб)Log dropped packets: нужно ли записывать в лог отфильтрованные сетевые пакеты
Log successful connections: нужно ли логировать успешные сетевые подключения (может получиться очень большой лог)

Чтобы понять, какой сетевой профиль заблокировал или пропустил определенное сетевое подключение, можно писать лог файервола в отдельный файл для каждого профиля. Например:
-
%windir%\system32\logfiles\firewall\pfirewall_domain.log -
%windir%\system32\logfiles\firewall\pfirewall_private.log -
%windir%\system32\logfiles\firewall\pfirewall_public.log
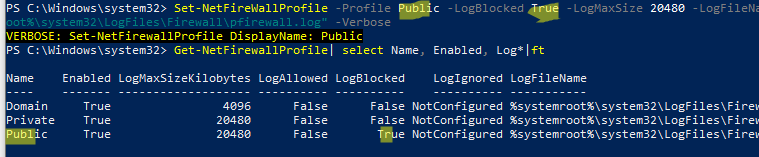
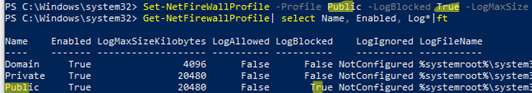
Также можно включить эти же параметры логирования Windows Firewall с помощью PowerShell:
Set-NetFireWallProfile -Profile Public -LogBlocked True -LogMaxSize 20480 -LogFileName "%systemroot%\system32\LogFiles\Firewall\pfirewall.log" -Verbose
Вывести текущие настройки логирования брандмауэра для всех профилей:
Get-NetFirewallProfile| select Name, Enabled, Log*|ft
Теперь Windows Firewall будет записывать в лог файлы все сетевые подключения. Вы можете открыть файл лога вручную или выполнить поиск по нему с помощью PowerShell. Командлет Select-String совмещает в себе аналог grep и tail для Windows.
Например, следующая команда будет выводить в реальном времени на экран все отфильтрованные (DROP) сетевые подключения на порт TCP порт 445 (SMB):
Get-Content C:\Windows\System32\LogFiles\Firewall\pfirewall.log -wait | Select-String -pattern "DROP.*TCP.*445"
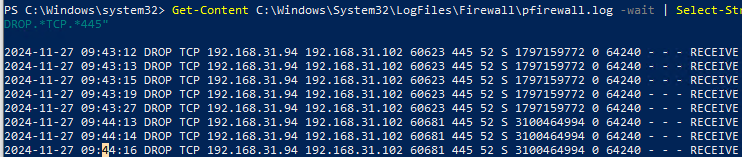
Используется такой формат лог файла:
date time action protocol src-ip dst-ip src-port dst-port size tcpflags tcpsyn tcpack tcpwin icmptype icmpcode info path pid
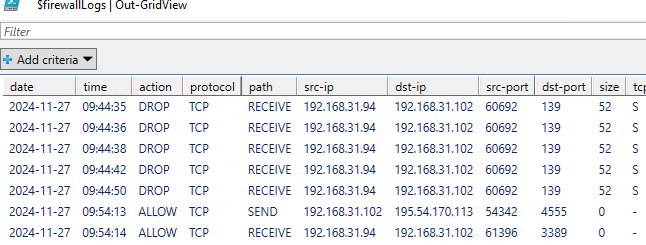
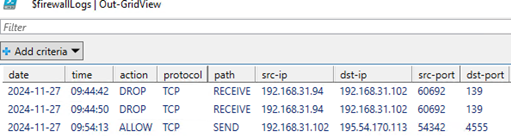
Для анализа лог файлов файервола можно воспользоваться такой PowerShell функцией, которая представит лог в виде удобной графической таблицы Out-GridView:
function Get-WindowsFirewallLog {
param(
[parameter(Position=0,Mandatory=$false)]
[ValidateScript({Test-Path $_})]
[string]$LogFilePath = "$env:SystemRoot\System32\LogFiles\Firewall\pfirewall.log"
)
$headerFields = @("date","time", "action","protocol","src-ip","dst-ip","src-port","dst-port","size", "tcpflags","tcpsyn", "tcpack","tcpwin","icmptype","icmpcode", "info","path")
$firewallLogs = Get-Content $LogFilePath | ConvertFrom-Csv -Header $headerFields -Delimiter ' '
$firewallLogs | Out-GridView
}
Get-WindowsFirewallLog
Запись логов Windows Firewall в журнал событий Windows
По сравнению с текстовыми файлам иногда более удобно записывать логи сетевых подключений Windows Firewall в журнал событий (Event Viewer). Для этого нужно включить политики аудита в локальной GPO:
- Откройте редактор локальной GPO (
gpedit.msc
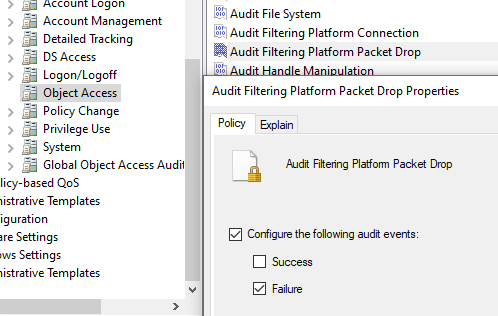
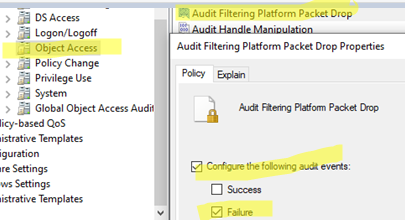
) - Перейдите в раздел Computer Configuration -> Windows Settings -> Security Settings -> Advanced Audit Policy Configuration -> System Audit Policies — Local Group Policy Object -> Object Access
- Параметр Audit Filtering Platform Packet drop позволяет включить аудит заблокированных подключений Windows Firewall. Откройте настройки политики и активируйте опцию Failure.

- Audit Filtering Platform Connection позволяет логировать успешные подключения. Используется эта политика аудита довольно редко, т.к. в лог будет писаться очень много событий (потребуется увеличение размеров журнала Event Viewer)
- Обновите настройки локальной GPO командой
gpupdate /force
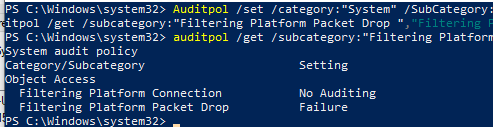
Такую политику аудита можно включить командой:
Auditpol /set /category:"System" /SubCategory:"Filtering Platform Packet Drop" /failure:enable
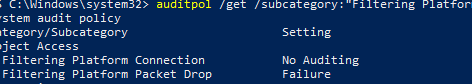
Вывести текущие настройки политика аудита Windows Firewall:
auditpol /get /subcategory:"Filtering Platform Packet Drop","Filtering Platform Connection"
Чтобы посмотреть события Windows Firewall, откройте Event Viewer (
eventvwr.msc
). Разверните Windows Logs -> Security. Включите фильтр событий по категории Filtering Platform Packet Drop.
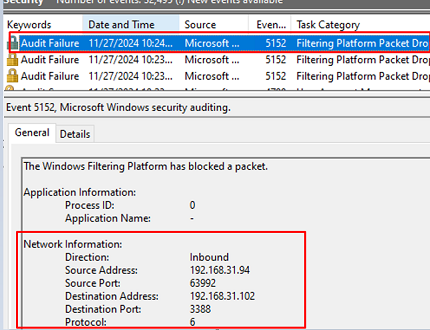
В списке событий появится все сетевые подключения, заблокированные Windows Firewall. Такие события будут иметь Event ID 5152 (
The Windows Filtering Platform has blocked a packet
). В описании события можно получить сетевую информацию: номер протокола (TCP-6, UDP-17, ICMP-1), IP адрес и порт источника/приемника, направление (Inbound, Outbound), процесс (для исходящих подключений).
Для поиска и фильтрации событий Windows Firewall в Event Viewer можно использовать PowerShell командлет Get-WinEvent. Следующий PowerShell скрипт выполнит поиск всех заблокированных брандмауэром событий (попыток) подключений на порт 3388 и выведет таблицу с временем подключения и источником:
$destinationPort = "3388"
$filterXml = @"
<QueryList>
<Query Id="0" Path="Security">
<Select Path="Security">
*[System[(EventID=5152)]]
and
*[EventData[Data[@Name='DestPort'] and (Data='$destinationPort')]]
</Select>
</Query>
</QueryList>
"@
$FirewallLogs = @()
$events=Get-WinEvent -FilterXml $filterXml
foreach ($event in $events) {
$eventXml = [xml]$event.ToXml()
$SourceAddress = $eventXml.Event.EventData.Data | Where-Object { $_.Name -eq 'SourceAddress' } | Select-Object -ExpandProperty '#text'
$DestPort = $eventXml.Event.EventData.Data | Where-Object { $_.Name -eq 'DestPort' } | Select-Object -ExpandProperty '#text'
$FirewallLog = New-Object PSObject -Property @{
SourceAddress= $SourceAddress
Time=$event.TimeCreated
DestPort=$DestPort
}
$FirewallLogs += $FirewallLog
}
$FirewallLogs
Таким образом, включив логи брандмауэра вы можете детально инспектировать все отброшенные и разрешенные взодящие/исходящие сетевые соединения, найти ошибки в своих правилах Windows Firewall и создать корректные.
Firewall Log Analyzer
A Python tool for analyzing firewall logs, detecting suspicious activity, and generating visualizations.
Features
- Parse and analyze firewall logs
- Generate statistics about source IPs, destination ports, and protocols
- Detect suspicious activity patterns
- Create visualizations of top offenders
- Export parsed data to CSV for further analysis
- Customizable suspicious activity thresholds
Installation
-
Clone this repository:
git clone https://github.com/harrymush/firewall_log_analyzer cd firewall_log_analyzer -
Create and activate a virtual environment (recommended):
# On macOS/Linux
python -m venv venv
source venv/bin/activate

# On Windows
python -m venv venv
venv\Scripts\activate
-
Install dependencies:
pip install -r requirements.txt
Usage
Basic Usage
- Place your firewall log file in the
logsdirectory - Run the analyzer:
python app.py logs/your_log_file.log
Command Line Options
# Use custom threshold for suspicious activity detection
python app.py --threshold 20 logs/your_log_file.log
# or
python app.py -t 20 logs/your_log_file.log

# View help
python app.py --help
Log File Format
The analyzer expects log entries in the following format:
SRC=<source_ip> DST=<destination_ip> PROTO=<protocol> SPT=<source_port> DPT=<destination_port>
Example log entry:
SRC=192.168.1.100 DST=10.0.0.1 PROTO=TCP SPT=12345 DPT=80
Output
The analyzer generates:
-
Console Output:
- Summary statistics
- Top source IPs, destination ports, and protocols
- Suspicious activity report
-
Files:
firewall_analysis.png: Visualizations of top offenderslogs/parsed_output.csv: Full parsed log data
Suspicious Activity Detection
The analyzer looks for:
- IPs making many requests (configurable threshold)
- Connections to sensitive ports (22/SSH, 23/Telnet, 3389/RDP, etc.)
- Unusual protocols (anything other than TCP/UDP)
Example
# Analyze logs with default settings
python app.py logs/firewall.log

# Analyze logs with custom threshold
python app.py -t 50 logs/firewall.log
Requirements
- Python 3.6+
- pandas
- matplotlib
Implementation Guide for Home Labs & Small Networks
Setting Up Log Collection
-
For pfSense/OPNsense Firewalls:
# Enable logging in the firewall settings
# Navigate to: Status > System Logs > Settings
# Enable logging and set the log format to match our parser
-
For Linux-based Firewalls (iptables/ufw):
# Add logging rules to iptables
sudo iptables -A INPUT -j LOG --log-prefix "FWLOG: "

# Configure rsyslog to format logs
sudo nano /etc/rsyslog.d/iptables.conf
# Add:
:msg, contains, "FWLOG:" -/var/log/iptables.log
-
For Windows Firewall:
- Enable logging in Windows Defender Firewall with Advanced Security
- Configure log format to include source/destination IPs and ports
Automated Log Analysis
-
Create a Log Rotation Script:
#!/bin/bash
# rotate_logs.sh
LOG_DIR="/path/to/logs"
ANALYSIS_DIR="/path/to/firewall_log_analyzer/logs"

# Copy and rotate logs
cp $LOG_DIR/firewall.log $ANALYSIS_DIR/firewall_$(date +%Y%m%d).log

# Run analysis
cd /path/to/firewall_log_analyzer
python app.py $ANALYSIS_DIR/firewall_$(date +%Y%m%d).log
-
Set Up Cron Job for Daily Analysis:
# Edit crontab
crontab -e

# Add this line to run daily at midnight
0 0 * * * /path/to/rotate_logs.sh
Monitoring and Alerts
-
Set Up Email Notifications:
# Add to app.py
import smtplib
from email.mime.text import MIMEText

def send_alert(subject, body):
    msg = MIMEText(body)
    msg['Subject'] = subject
    msg['From'] = 'your-email@example.com'
    msg['To'] = 'admin@example.com'

    with smtplib.SMTP('smtp.server.com', 587) as server:
        server.starttls()
        server.login('username', 'password')
        server.send_message(msg)
-
Configure Alert Thresholds:
- Modify the
request_thresholdbased on your network’s normal traffic patterns - Add custom sensitive ports based on your services
- Set up alerts for specific IP ranges or patterns
- Modify the
Best Practices
-
Log Retention:
- Keep at least 30 days of logs for trend analysis
- Compress old logs to save space
- Consider using a log management system for larger deployments
-
Security Considerations:
- Store logs in a secure location
- Restrict access to log files
- Use secure protocols for log transfer
- Regularly review and update detection rules
-
Performance Optimization:
- For large log files, consider splitting analysis into chunks
- Schedule analysis during off-peak hours
- Use a dedicated machine for log analysis if possible
Example Home Lab Setup
# Directory structure
/home/analytics/
├── firewall_log_analyzer/
│   ├── app.py
│   ├── src/
│   └── logs/
└── scripts/
    └── rotate_logs.sh

# Sample crontab entry
0 */4 * * * /home/analytics/scripts/rotate_logs.sh >> /var/log/firewall_analysis.log 2>&1
Are you sure everything is fine?
Windows 10 and 11 integrate Windows Defender Firewall, a powerful software that protects your system from unwanted inbound or outbound connections.
Have you ever wondered why you never get alerts of unsolicited connection attempts?
Well, the truth is, there is no way to easily analyze firewall activity, or at least there wasn’t until now!
Take back control of your network with advanced tools to analyze your Windows Defender Firewall activity.
Firewall Log Viewer is our flagship software to easily understand what’s going on and quickly spot any red flags.
Super easy to use, life-saving, you can open any Windows Defender Firewall log file and start analyzing, improving and grouping data with our smart filters.
Common corrective actions include fixing rules, router configurations and cleaning the pc from unwanted software, but the first step is always a good log analysis.
Features
- Compatible with Windows Defender Firewall log files (Windows 10 and 11)
- Modern, easy to use, user interface
- Automatic IP Geolocalization (IP to Country)
- Filtering, grouping and sorting on any field
- Insight Charts for multiple fields
- Blacklisted IP based on publicly available lists of suspicious IP addresses
- Works with IPv4 and IPv6
- Data Export to .CSV format (Microsoft Excel compatible)
- Designed for IT pros and Advanced users
- App available on the Microsoft Store
Frequently Asked Questions
Why should I buy Firewall Log Viewer?
Firewall Log Viewer is a professional tool designed to prevent threats and data leaks by analyzing Windows Firewall log files quickly and easily. The app help you to save time and improve the quality of results by automating repetitive tasks. We hope you are not still using notepad.
Is the software compatible with Windows 10/11 Home Edition or S mode?
Yes
Where is the Windows Firewall control panel?
Please check out this article
How can I enable Windows Firewall logging?
Please check out this article
Where are log files?
The default path is «%systemroot%\system32\logfiles\firewall» and the log is usually named «pfirewall.log»
What are blacklisted IP?
To help you analyze log files, Source and Destination IP addresses are compared against publicly available lists of suspicious IP addresses. These connections are highlighted in red and should be analyzed very carefully.
How often is the blacklist database updated?
Every time you start the software
Why I can’t directly open log files from the system folder?
The current user may require additional permission to access the system folder. Try to copy log files in the Desktop or in another folder accessible by the current user.
This site uses cookies to deliver its services and to analyze traffic.
Your IP address and metrics may be shared with thirty parties to ensure quality of service, generate usage statistics, and to detect and address abuse.
OK
If you suspect that the built-in Windows Defender firewall is blocking network connections (from a specific program or service), it is a bad idea to disable it completely. Instead, you can log all network traffic that passes through the Windows Defender Firewall, identify the filtered/dropped packets, find ports and source/destination IP addresses, and then create appropriate allow rules.
In this article, we’ll show how to enable network connection logging in Windows Firewall and how to analyze the logs.
Contents:
- Enable Logging in Windows Firewall
- Parsing Windows Firewall Logs with PowerShell
- View Windows Firewall Logs in Event Viewer
Enable Logging in Windows Firewall
Windows Defender Firewall allows to log both successful and blocked network connections. Logging can be enabled separately for each network profile (Private, Public, or Domain Network). By default, traffic logging is disabled in the Windows Firewall. To turn on traffic debugging in the firewall :
- Open the snap-in Windows Firewall with Advanced Security MMC (
wf.msc). - Right-click on the root of the console and select Properties;
- Then go to the tab of the Windows network profile for which you want to enable logging (Domain, Private, or Public Profile).
- On the Profile tab, click the Customize button in the Logging section.
- Here you can configure the following settings:
Name (log file): by default%systemroot%\system32\LogFiles\Firewall\pfirewall.log
Size limit: increase the maximum log size from 4 MB to 20 MB (20480KB)
Log dropped packets: is it necessary to log dropped packet connections?
Log successful connections: logging all successful network connections can result in a very large log file.

To effectively monitor and understand which network profile (Domain, Private, or Public) is blocking or allowing specific network connections, you can configure Windows Firewall to log the activity of each profile in a separate log file. For example:
%windir%\system32\logfiles\firewall\pfirewall_domain.log%windir%\system32\logfiles\firewall\pfirewall_private.log%windir%\system32\logfiles\firewall\pfirewall_public.log
Windows Firewall logging options can also be configured through PowerShell:
Set-NetFireWallProfile -Profile Public -LogBlocked True -LogMaxSize 20480 -LogFileName "%systemroot%\system32\LogFiles\Firewall\pfirewall.log" -Verbose
Lists the current firewall logging settings for all profiles:
Get-NetFirewallProfile| select Name, Enabled, Log*|ft
Parsing Windows Firewall Logs with PowerShell
All network connections are now logged to a plain text file by the Windows Firewall. You can open the log file manually, or use PowerShell to search for specific connections in the log file (the Windows equivalent of the grep and tail commands is the Select-String cmdlet).
For example, the following command displays in real-time all filtered (DROP) network connections to TCP port 445 (SMB):
Get-Content C:\Windows\System32\LogFiles\Firewall\pfirewall.log -wait | Select-String -pattern "DROP.*TCP.*445"

The following log file format is used:
date time action protocol src-ip dst-ip src-port dst-port size tcpflags tcpsyn tcpack tcpwin icmptype icmpcode info path pid
Use this PowerShell function, which displays the log in a convenient Out-GridView graphical table, to analyze the firewall log files:
function Get-WindowsFirewallLog {
 param(
 [parameter(Position=0,Mandatory=$false)]
 [ValidateScript({Test-Path $_})]
 [string]$LogFilePath = "$env:SystemRoot\System32\LogFiles\Firewall\pfirewall.log"
 )
 $headerFields = @("date","time", "action","protocol","src-ip","dst-ip","src-port","dst-port","size", "tcpflags","tcpsyn", "tcpack","tcpwin","icmptype","icmpcode", "info","path")
 $firewallLogs = Get-Content $LogFilePath | ConvertFrom-Csv -Header $headerFields -Delimiter ' '
 $firewallLogs | Out-GridView
 }
 Get-WindowsFirewallLog
View Windows Firewall Logs in Event Viewer
It is sometimes more convenient to write Windows Firewall connection logs to the Event Viewer rather than to text files. This can be achieved by enabling audit policies in the local GPO:
- Open the local GPO editor (
gpedit.msc) - Go to Computer Configuration -> Windows Settings -> Security Settings -> Advanced Audit Policy Configuration -> System Audit Policies — Local Group Policy Object -> Object Access
- Blocked connection events can be sent to the Event Viewer using the Audit Filtering Platform Packet Drop policy. Enable the Failure option in the policy settings.
- Audit Filtering Platform Connection parameter used to log successful connections in Windows Firewall. This audit policy is rarely used because enabling it can result in many events being written to the log (this requires increasing the maximum size of the Event Viewer log)
- Update the GPO settings on the computer:
gpupdate /force
This audit policy can be enabled with the command:
Auditpol /set /category:"System" /SubCategory:"Filtering Platform Packet Drop" /failure:enable
View the current Windows Firewall audit policy settings:
auditpol /get /subcategory:"Filtering Platform Packet Drop","Filtering Platform Connection"
To view Windows Firewall events, open Event Viewer (eventvwr.msc). Expand Windows Logs -> Security. Enable the event filter for the Filtering Platform Packet Drop category.
All the connections that are blocked by the Windows Firewall will be available in the Event viewer. These events have EventID 5152 ( The Windows Filtering Platform has blocked a packet ). The event description includes network packet information: protocol number (TCP – 6, UDP 17, ICMP 1), IP address and source/destination port, direction (Inbound, Outbound), process name (for outgoing connections).
Use the Get-WinEvent PowerShell cmdlet to search and filter Windows Firewall events in Event Viewer. The following PowerShell script finds all connection attempts that are blocked by the Windows Firewall on port 3388 and returns a table with the time and source of the connection:
$destinationPort = "3388"
 $filterXml = @"
 <QueryList>
 <Query Id="0" Path="Security">
 <Select Path="Security">
 *[System[(EventID=5152)]]
 and
 *[EventData[Data[@Name='DestPort'] and (Data='$destinationPort')]]
 </Select>
 </Query>
 </QueryList>
 "@
 $FirewallLogs = @()
 $events=Get-WinEvent -FilterXml $filterXml
 foreach ($event in $events) {
 $eventXml = [xml]$event.ToXml()
 $SourceAddress = $eventXml.Event.EventData.Data | Where-Object { $_.Name -eq 'SourceAddress' } | Select-Object -ExpandProperty '#text'
 $DestPort = $eventXml.Event.EventData.Data | Where-Object { $_.Name -eq 'DestPort' } | Select-Object -ExpandProperty '#text'
 $FirewallLog = New-Object PSObject -Property @{
 SourceAddress= $SourceAddress
 Time=$event.TimeCreated
 DestPort=$DestPort
 }
 $FirewallLogs += $FirewallLog
 }
 $FirewallLogs
Enabling firewall logging allows you to inspect all allowed and dropped network connections, helping identify errors in your Windows Firewall rules and create accurate ones.