
Все способы:
- Способ 1: Журнал событий
- Способ 2: Сторонние приложения
- WinDbg
- BlueScreenView
- Вопросы и ответы: 1
Способ 1: Журнал событий
Простой, но не самый удобный способ определения кода синего экрана, так как он предполагает выполнение дополнительных действий.
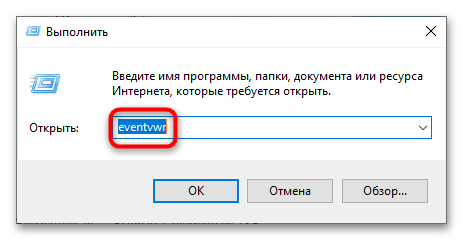
- Откройте системный «Журнал событий» командой
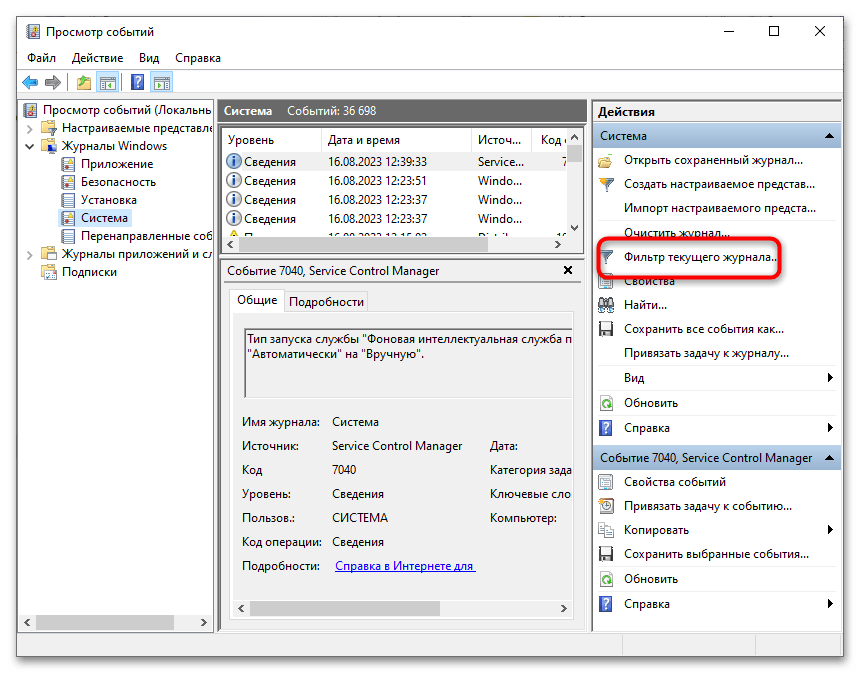
eventvwr.msc, выполненной в вызванном нажатием клавиш Win + R диалоговом окошке быстрого запуска. - Нажмите в правой колонке ссылку «Фильтр текущего журнала».
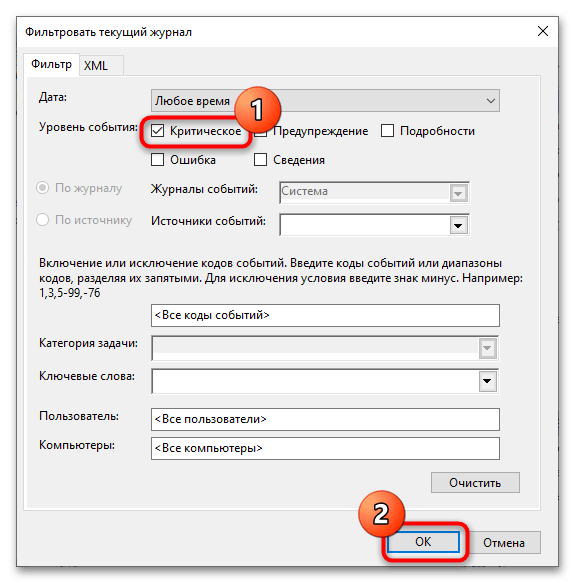
- В открывшемся окне отметьте флажком пункт «Критическое» и нажмите «ОК», чтобы отфильтровать события.
- Выберите последнюю запись об ошибке и откройте ее свойства двойным по ней кликом.
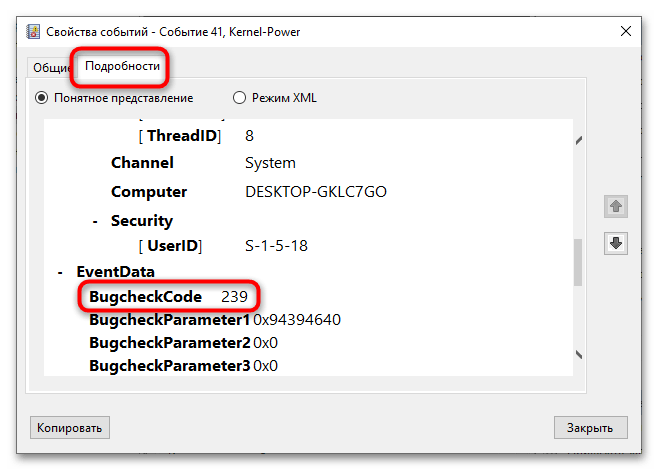
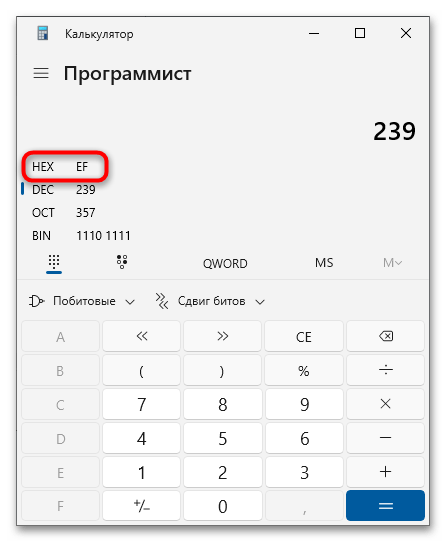
- Переключитесь на вкладку «Подробности», отыщите в списке параметр «BugCheckCode» и посмотрите его значение. Это и будет код ошибки в десятичном счислении.
- Переведите его в шестнадцатеричную систему счисления, воспользовавшись штатным «Калькулятором» Windows, переключив его в режим «Программист» (через меню, вызванное нажатием по кнопке меню слева вверху). Результат будет указан в строке «HEX» без нулей, которые понадобится добавить. Например, EF = 0x000000EF.
Теперь можно выполнить поиск решения проблемы в интернете, указав полученный шестнадцатеричный код ошибки BSOD.
Способ 2: Сторонние приложения
Удобнее определять ошибку через специальные приложения, работающие с файлом дампа. По умолчанию его создание включено в Windows, но если вы отключали его создание вручную, то просмотреть стоп-код таким образом не получится из-за отсутствия файла для анализа сбоя.
WinDbg
Синий экран со стоп-ошибками в Windows 10 не отличается информативностью и нередко содержит только название ошибки, но не ее код. Чтобы определить ее код, необходимо проанализировать файл минидампа. Сделать это можно средствами фирменной утилиты Microsoft WinDbg.
Скачать WinDbg с официального сайта
- Скачайте приложение для анализа дампов с Microsoft Store или официальной страницы разработчика и установите.
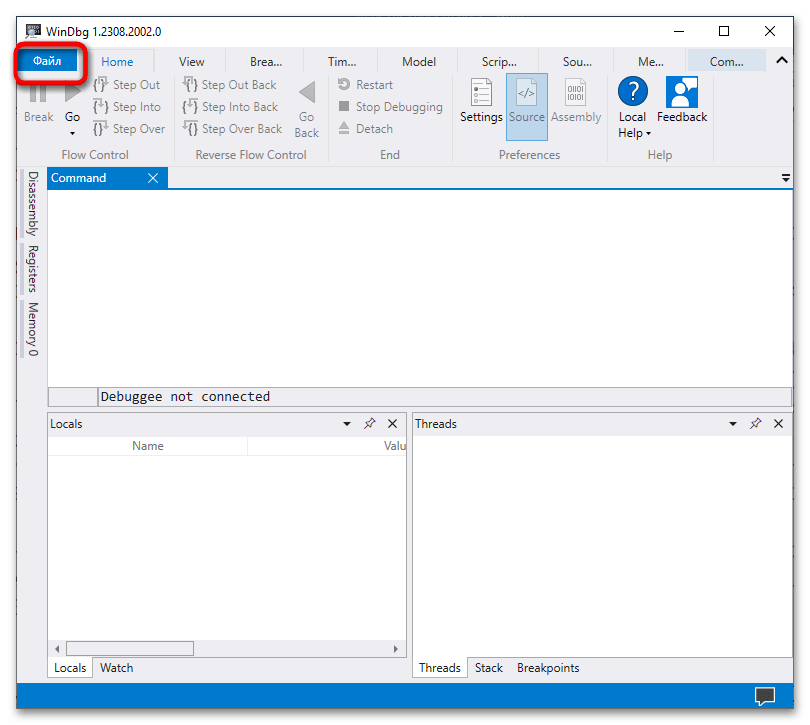
- Запустите программу от имени администратора и нажмите в левом верхнем углу кнопку «Файл».
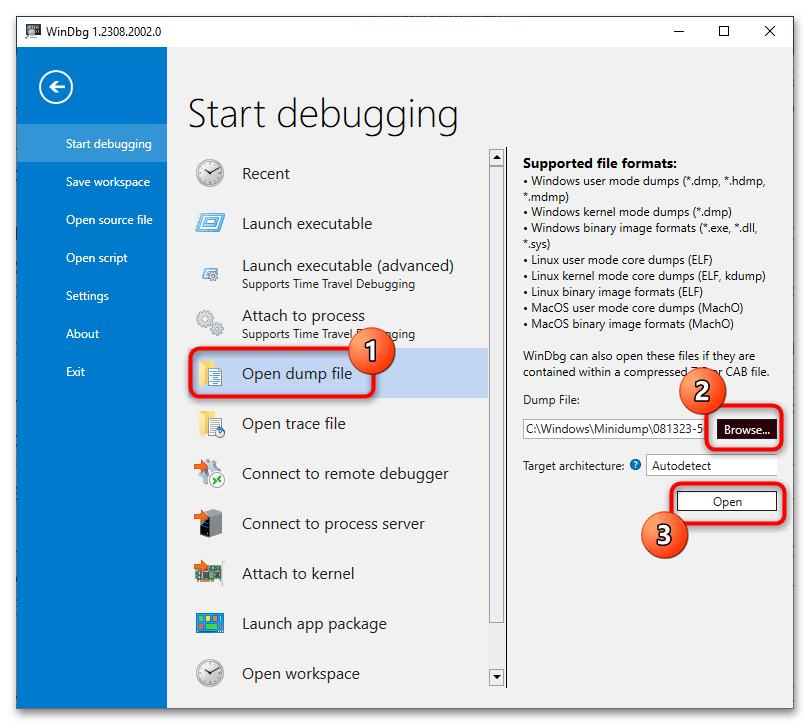
- Выберите в меню опцию «Open dump file», нажмите кнопку «Browse», укажите путь к анализируемому файлу дампа в папке
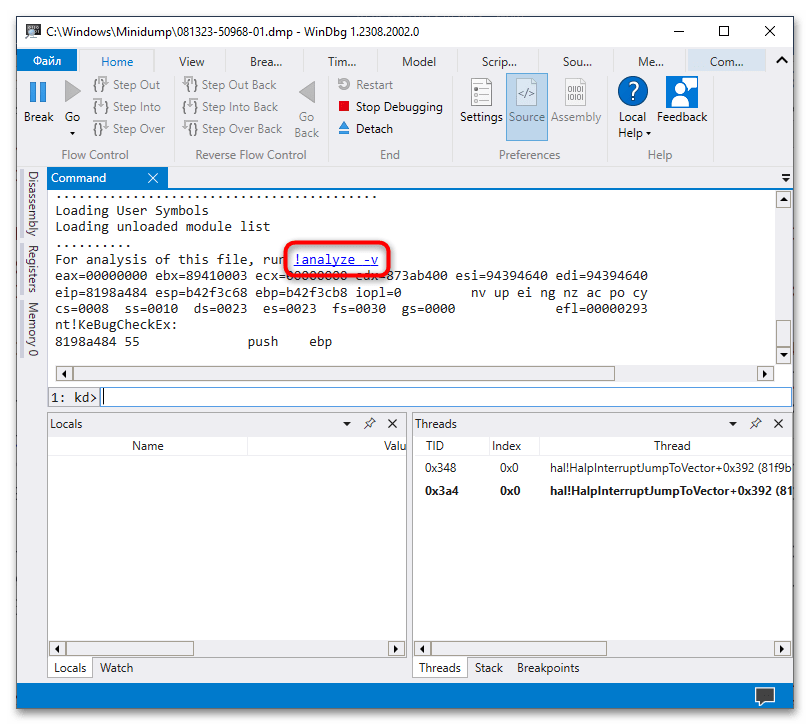
C:\Windows\Minidumpи нажмите «Open». Папка Minidump может содержать несколько файлов c расширением DMP, из них следует выбирать тот, который имеет название, соответствующее дате и времени ошибки синего экрана. - Прокрутите содержимое блока «Command» вниз, найдите ссылку «!analyze -v» и кликните по ней. Вместо этого можно вставить команду
!analyze -vв поле под блоком «Command» и нажать клавишу ввода. - Отладчик выполнит анализ файла дампа и выведет в блок «Command» подробные сведения об ошибке. Ищите ее название – код будет указан напротив него в полном или сокращенном виде, например 139, 0x139 или 0x00000139.
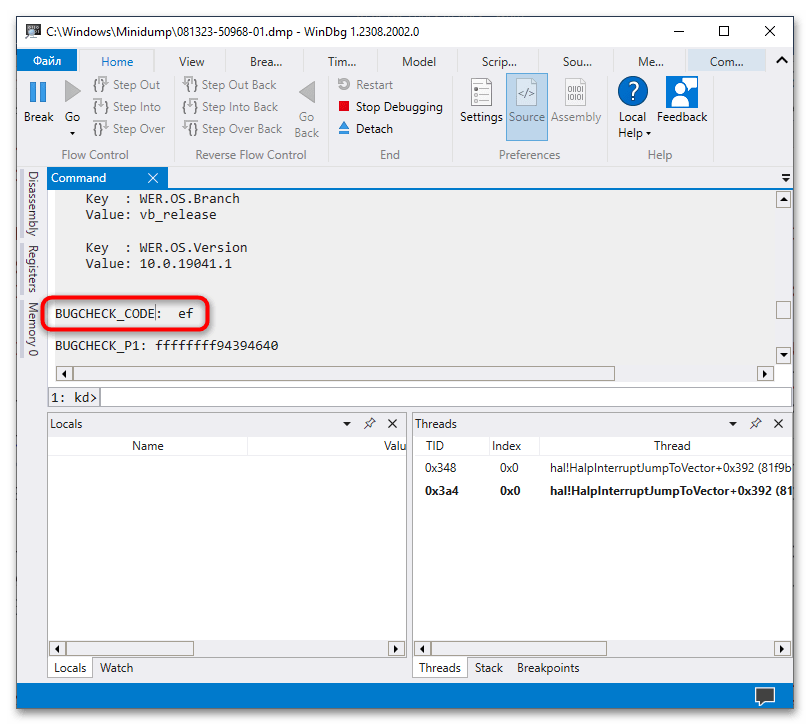
Кроме кода WinDbg позволяет получать множество других полезных сведений об ошибке, в частности аргументы и имя исполняемого файла, вызвавшего критический сбой.
BlueScreenView
Для получения кода ошибки экрана BSOD также можно использовать стороннюю утилиту BlueScreenView. Она не настолько функциональна как WinDbg, но намного проще и меньше инструмента от Microsoft.
Скачать BlueScreenView с официального сайта
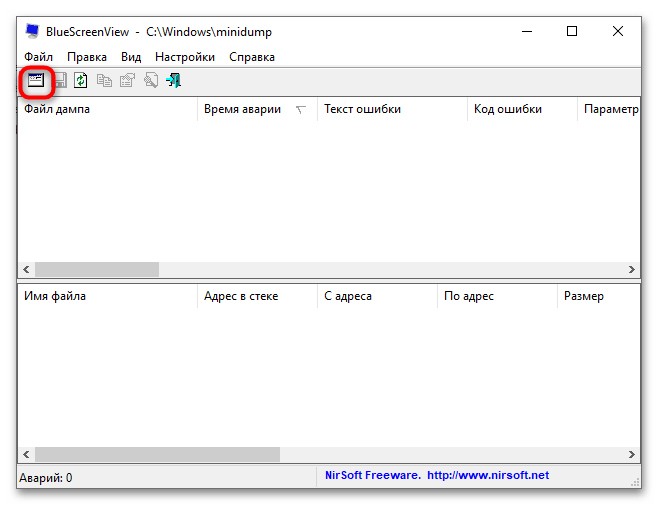
- Скачайте архив с утилитой с сайта разработчика, распакуйте его и запустите исполняемый файл. Там можно скачать и языковой файл — для русификации интерфейса поместите языковой файл в папку с исполняемым файлом «BlueScreenView.exe».
- По умолчанию утилита автоматически считывает все файлы дампов в папке
C:\Windows\Minidump, но если в вашем случае файл дампа находится в другом месте, откройте дополнительные параметры утилиты комбинацией клавиш Ctrl + 0. - В открывшемся окошке выберите пункт «Загрузить один файл МиниДампа» и укажите путь к файлу DMP.
- Просмотрите содержимое колонки «Код ошибки» — в нем будет указан искомый код в шестнадцатеричном формате.

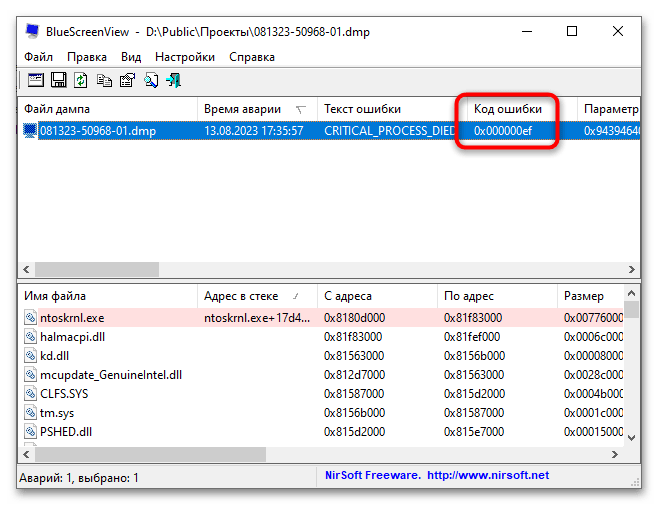
Помимо кода ошибки синего экрана, утилита BlueScreenView показывает сбойный драйвер, список связанных файлов, параметры, стеки адресов и другие отладочные сведения.
Наша группа в TelegramПолезные советы и помощь
При возникновении синих экранов BSoD Windows 11, 10 и другие версии системы создают дамп (снимок состояния) оперативной памяти, содержащий отладочную информацию, которую можно использовать для диагностики и определения причин сбоя. Функция обычно включена по умолчанию, но если дампы памяти не создаются, их можно включить: Как включить создание дампов памяти в Windows.
Подробным анализом дампов памяти занимаются разработчики, но и для рядового пользователя, столкнувшегося с синими экранами в Windows это может оказаться полезным: адреса в памяти ему ничего не дадут, но часто можно обнаружить имя файла приложения или драйвера, вызывающее сбой. Здесь помогут специальные программы для анализа дампов памяти, о которых и пойдёт речь далее.
WinDbg

У Майкрософт имеется собственный инструмент отладки и анализа дампов памяти — WinDbg (пока Preview). Скачать его для Windows 11 и Windows 10 можно из Microsoft Store, используя поиск в магазине приложений или прямую ссылку.
Пример простого анализа дампа памяти для обычного пользователя с целью выявления процесса, вызвавшего BSoD с помощью WinDbg:
- Запустите WinDbg от имени Администратора (правый клик по ярлыку в меню «Пуск» — «Запуск от имени администратора»).
- В главном меню программы выберите «Файл» — «Open dump File» и укажите путь к нужному мини-дампу, обычно находящемуся в папке C:\Windows\Minidump, нажмите кнопку «Open».

- Введите команду
!analyze -v
в поле ввода команд (либо нажмите по ссылке с командой в верхней панели WinDbg) и дождитесь завершения анализа.

- В панели «Command» в верхней части окна программы будет отображен результат анализа, где, при удаче, вы сможете найти информацию о том, каким процессом был инициирован сбой (PROCESS_NAME).
- Может быть информация о файле драйвера (.sys) в поле IMAGE_NAME и другая информация, позволяющая найти источник проблемы.


Далее полученную информацию можно использовать для того, чтобы найти, каким устройствам соответствуют драйверы в Интернете, выяснить назначение процессов вызвавших сбой, предпринять те или иные действия с целью их устранения.
BlueScreenView
BlueScreenView — очень простая утилита, которая позволяет выбрать файла дампа памяти в списке и посмотреть, какие файлы драйвера и процессы привели к сбою: в окне программы они будут выделены красным цветом.

Скачать BlueScreenView можно с официального сайта разработчика https://www.nirsoft.net/utils/blue_screen_view.html
WhoCrashed
Ещё одна программа для анализа дампов памяти — WhoCrashed. В бесплатной версии предоставляет не так много информации.
После нажатия кнопки «Analyze» имеющиеся дампы памяти анализируются, и на вкладке «Report» выводятся коды ошибок, а также текстовое описание на английском языке о том, что означает этот код и о возможных причинах сбоя.

Официальный сайт WhoCrashed https://www.resplendence.com/whocrashed, судя по всему, не открывается из РФ, но утилиту легко найти и скачать из сторонних источников.
Автор Владимир!
Привет друзья! Недавно на нашем сайте вышла статья о Синем экране смерти в Windows 10. В ней мы подробно описали как восстановить ОС, в случае появления BSOD. Вся сложность восстановления системы после критической ошибки на синем экране состоит в том, что Windows перестаёт нормально загружаться и необходим загрузочный LiveCD с программой BlueScreenView, чтобы определить некорректные системные файлы или драйвера, вызвавшие ошибку. В сегодняшней статье я хочу рассказать ещё об одном инструменте под названием «Анализатор сбоев», с помощью которого можно проанализировать аварийные дампы памяти и установить причину появления в вашей Windows синего экрана. Чем примечателен этот инструмент? Дело в том, что находится он на загрузочном диске спасения MSDaRT 10, на котором имеется ещё с десяток полезных утилит для восстановления ОС после серьёзного сбоя. Из ISO-образа MSDaRT можно сделать загрузочную флешку, затем загрузить с неё компьютер и установить причину появления BSOD. Читаем подробности.
Как узнать причину возникновения синего экрана смерти (BSOD) в случае, если Windows 10 не загружается. Или как пользоваться инструментом «Анализатор сбоев» загрузочного диска восстановления Microsoft Diagnostic and Recovery Toolset 10 x64 (MSDaRT)
Microsoft Diagnostics and Recovery Toolset или сокращённо MSDaRT — знаменитейший LiveCD для аварийного восстановления Windows, появившийся в далёком 2006 году и называвшийся тогда ERD Commander. С помощью него можно было запросто восстановить Windows XP после серьёзного сбоя. В том же году идея была приобретена Microsoft и до сих пор постоянно усовершенствуется, надо сказать, диск и сегодня довольно актуален среди профессиональных системных администраторов. Для Windows 10 используется версия MSDaRT 10. С помощью LiveCD можно подключится к незагружающейся Win 10 и произвести различные манипуляции для её восстановления, к примеру: отредактировать реестр и автозагрузку, восстановить удалённые файлы и др. Также диск содержит «Мастер решений», способный подсказать вам, какой именно инструмент выбрать в той или иной критической ситуации. Ещё MSDaRT 10 имеет «Анализатор сбоев», с помощью которого можно произвести анализ аварийных дампов памяти и сегодня я покажу вам, как это можно сделать.
К большому сожалению MSDaRT 10 входит в состав платного пакета Microsoft Desktop Optimization Pack 2015. Как скачать данный пакет и создать с помощью него MSDaRT читайте в этой статье. Не удивлюсь и предположу, что многие пользователи не будут заморачиваться и скачают уже готовый ISO-образ MSDaRT на торренте, из которого потом сделают загрузочную флешку программой WinSetupFromUSB.
Итак, думаю для вас не составило труда раздобыть DaRT 10 и создать из него загрузочную флешку.
Загружаем с флешки наш компьютер с ошибкой синего экрана.
Мне не нужен интернет и я жму «Нет».

Раскладка клавиатуры «Русская».

«Поиск и устранение неисправностей»

Microsoft Diagnostics and Recovery Toolset.

В главном окне диска видим все доступные инструменты.
Выбираем «Анализатор сбоев (Анализ аварийных дампов)»

Далее.

Обзор.

В появившемся проводнике выбираем диск MSDaRT (буква диска — Boot (X:), затем Program Files и Debugging Tools for Windows.
ОК.

Далее.

У вас автоматически должен быть отмечен пункт «Загрузить файлы символов в эту папку» C:\symbols.
Далее.

Место расположения файла аварийного дампа памяти MEMORY.DMP должно быть выбрано автоматически — C:\Windows.
Далее.

Происходит анализ аварийного дампа.

Смотрим результат анализа сбоя, с указанием виновного драйвера.
Также рассмотрим расширенные данные об ошибке BSOD. Жмём на кнопку «Сведения»

На вкладке «Сообщение о сбое» указывается драйвер причины BSOD.

На вкладке «Загруженные драйверы» указывается установленные на момент сбоя драйвера.

На вкладке «Дополнительно» содержание лога с полной информацией о сбое системы.


Метки к статье: LiveDisk MSDaRT Ошибки
Updated on Apr 28, 2025
The blue screen of death (BSOD) is a common issue that Windows users sometimes encounter. There are various types of BSOD errors, such as exFAT FILE SYSTEM or Hidparse.sys BSOD, each with its own distinct causes. To resolve these errors, it’s essential to identify the root cause by reviewing the corresponding blue screen logs.
However, many people aren’t sure how to view blue screen codes/logs in Windows 11/10. Keep reading this guidance provided by EaseUS for more information. Understanding how to locate blue screen logs is crucial for fixing BSOD errors.
Here, you’ll be guided through four quick and easy ways to check or view blue screen codes/logs in Windows 11/10. Choose the method that best matches your technical comfort level. The ultimate goal is to review past blue screen codes/logs.
Way 1. BSOD Logs Viewer — EaseUS Partition Master
EaseUS Partition Master Professional is undoubtedly a fantastic partition management tool with robust features. It helps you view BSOD logs. With this boot error repair tool, users can easily check the blue screen error codes without navigating through complex system settings, making the process much faster and simpler than other methods.
Here’s how to view the previous blue screen error codes via EaseUS Partition Master:
If your computer is unbootable now, start with Step 1 here. If it’s bootable, move to Step 3 and start the process.
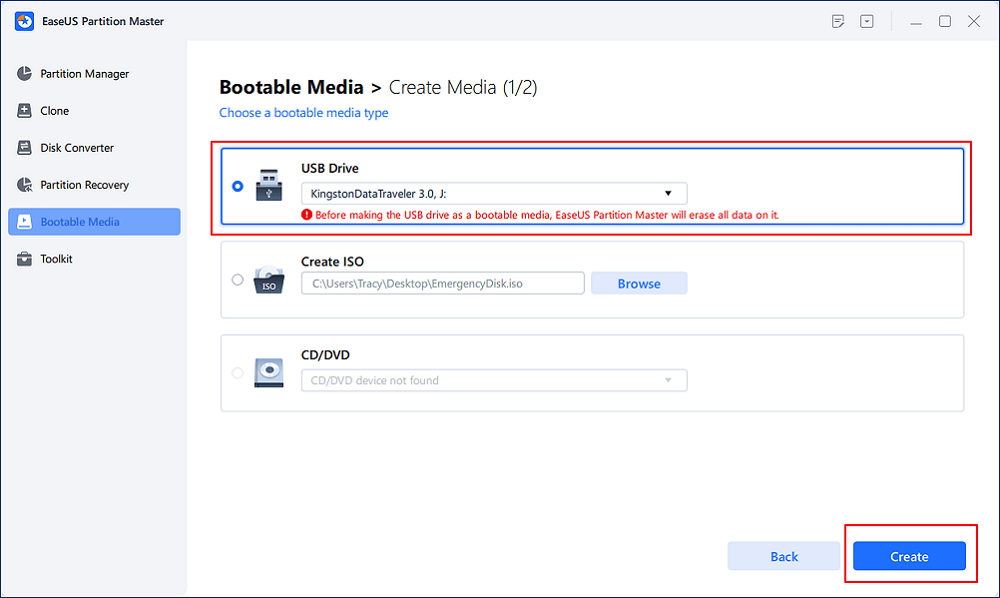
Step 1. Prepare a new PC and create a bootable media with EaseUS Partition Master
- On a new computer, connect an empty USB to your PC.
- Install and launch EaseUS Partition Master, go to the Bootable Media section, select «Create bootable media» and click «Next».
- Select the empty USB or external disk as target disk to create the bootable media for creating a Blue Screen error check tool.
Step 2. Boot PC from EaseUS bootable USB
Then, connect the bootable USB to your PC with Blue screen error, and reboot PC from the USB by configuring it as a boot drive. The process is: restart PC, press F2/F8/F11/Del key to enter BIOS, go to boot menu and configure the USB as boot drive, save changes and restart the PC.
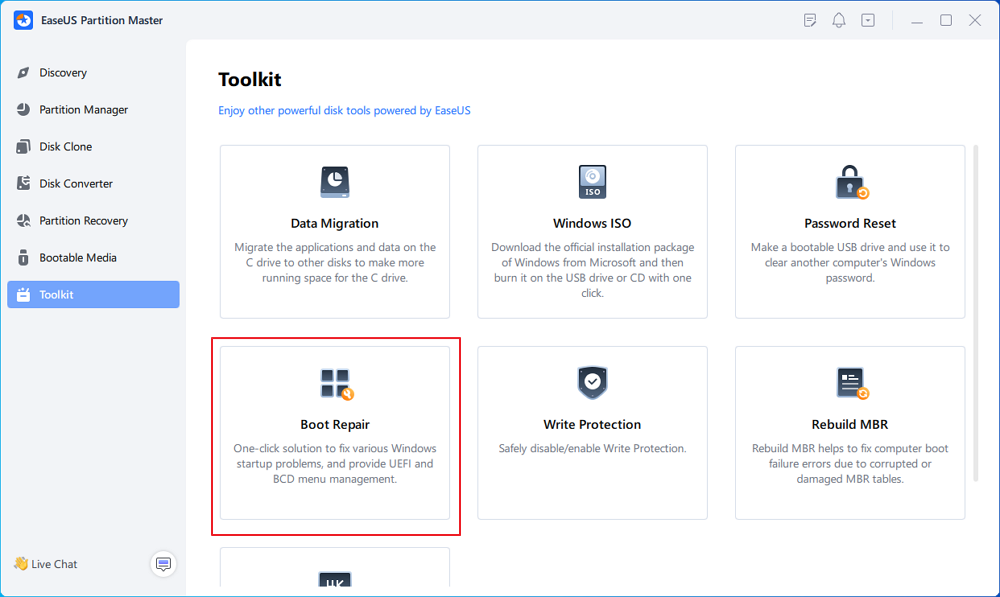
Step 3. Enable EaseUS Partition Master with its Boot Repair feature, and open «Blue Screen» tool.
When EaseUS Partition Master launches, go to the Toolkit section and click «Boot Repair».
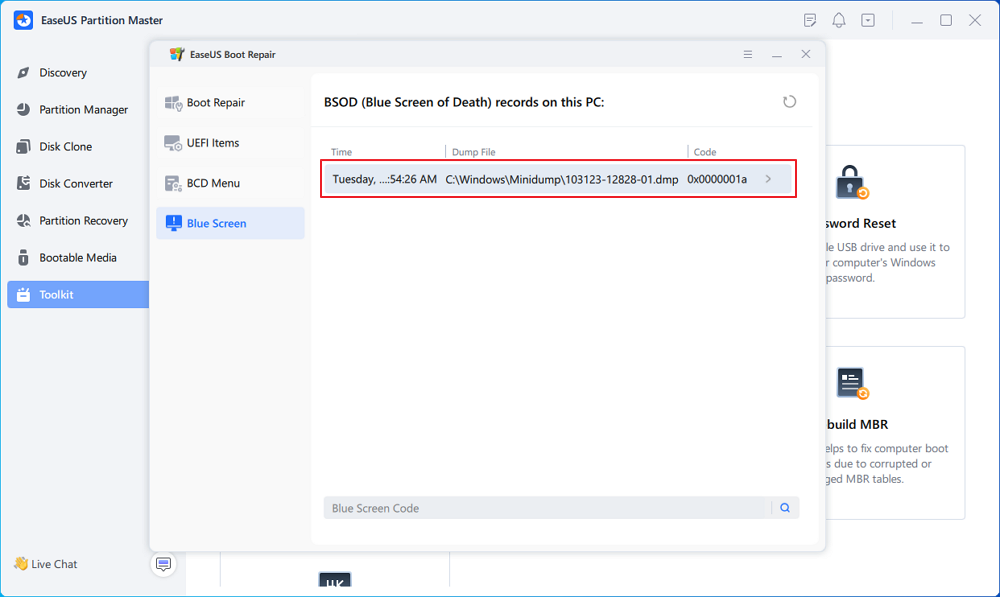
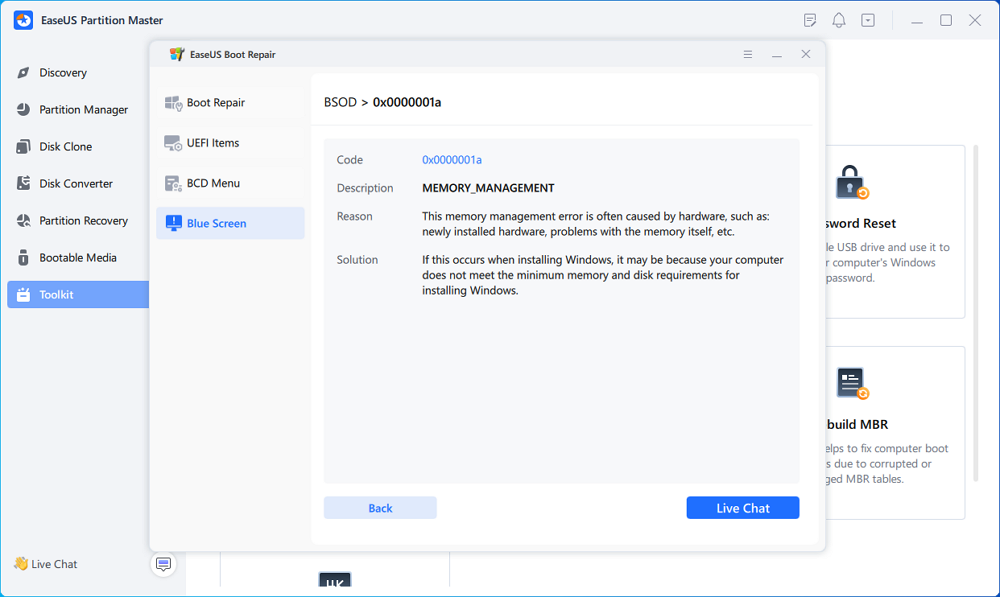
Then, click «Blue Screen» and click the listed Blue Screen error to check it’s details. Or, you can type in a specific blue screen code or description to find the respective answer for fixing it.
Step 4. Fix blue screen error
- Now, you can follow the solution guide to get rid of the respective BSOD or blue screen issue from your PC.
- If it doesn’t work, you can also click the «Live Chat» button to request a remote assistance for fixing this issue with the help of EaseUS tech support team.
Other Features of EaseUS Partition Master:
- Fix Windows 11 Blue Screen of Death
- Fix BSOD with a sad face
- Repair Unexpected Store Exception BSOD Error
- Fix Black Myth Wukong Blue Screen (BSOD) Issue
Try EaseUS Partition Master to see if it meets your needs for BSOD troubleshooting and disk management.
Way 2. Check Blue Screen Codes via Event Viewer
Event Viewer is another reliable option for checking Windows 11’s blue screen logs. Follow the steps:
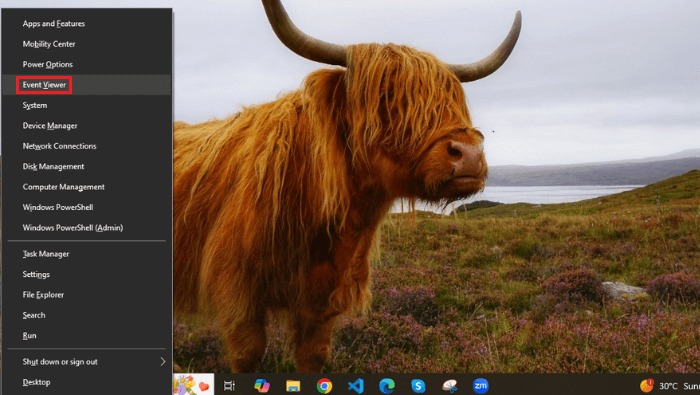
Step 1. Press the Win + X keys and choose Event Viewer.
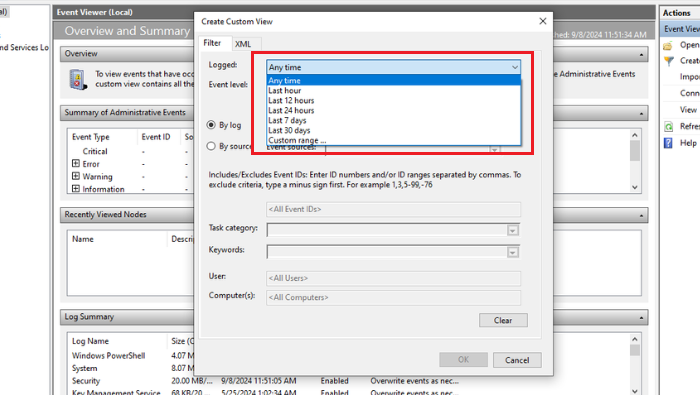
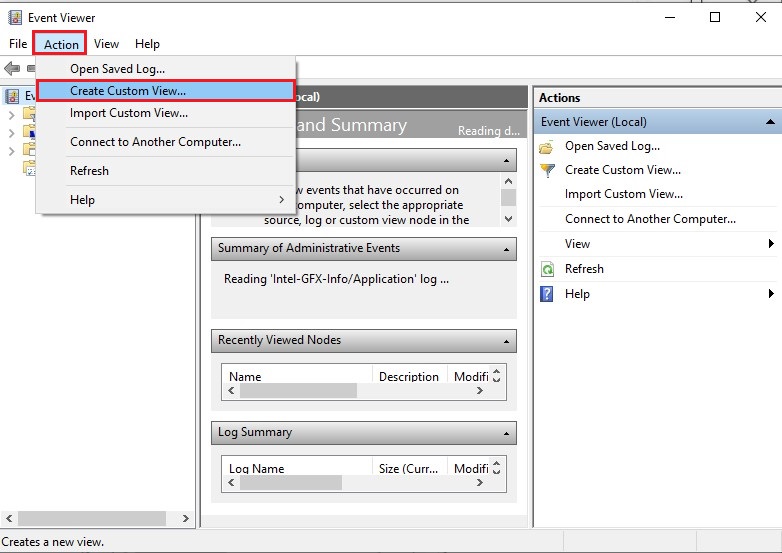
Step 2. In the top menu, click on the Action tab and select Create Custom View.

Step 3. From the Logged drop-down menu, pick the time frame during which the BSOD occurred.
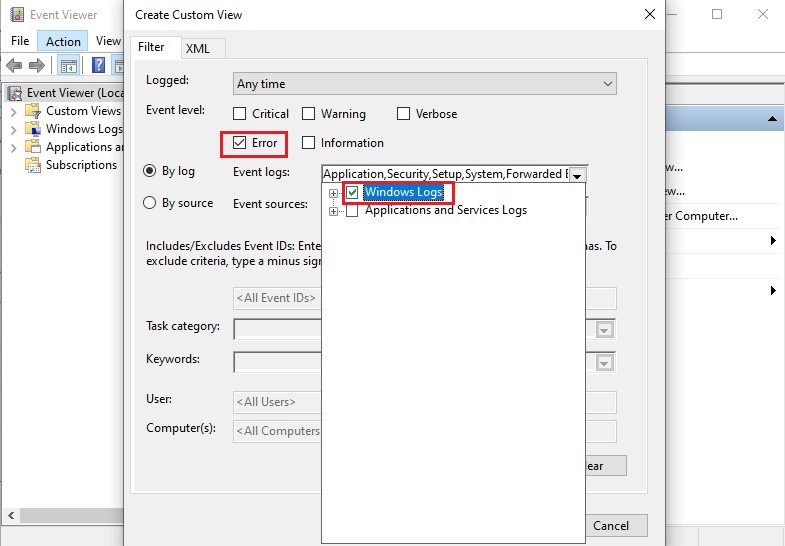
Step 4. In the Event Logs drop-down menu, check the box for Windows Logs and then tick the Error option under the Event Level section.
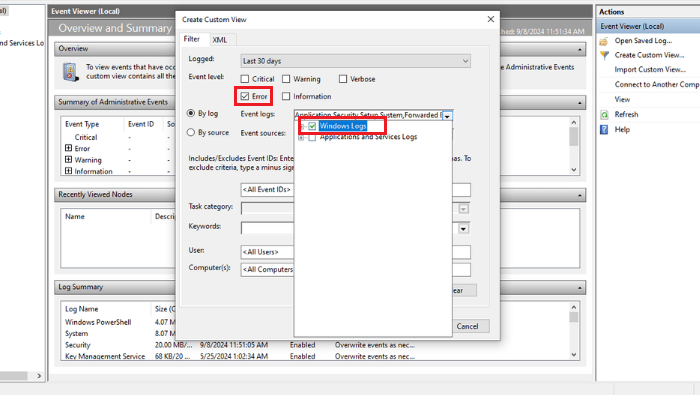
Step 5. Click OK and enter a name and description for your BSOD log when prompted, then press OK again.
Step 6. You will now see a list of errors from the chosen time period. You can sort them by date and time and view further details by selecting the General and Details tabs.
Way 3. View Blue Screen Logs via Registry Editor
You can access important details about your system through Windows Registry Editor, including blue screen of death (BSOD) logs. Here’s how to check through Registry Editor:
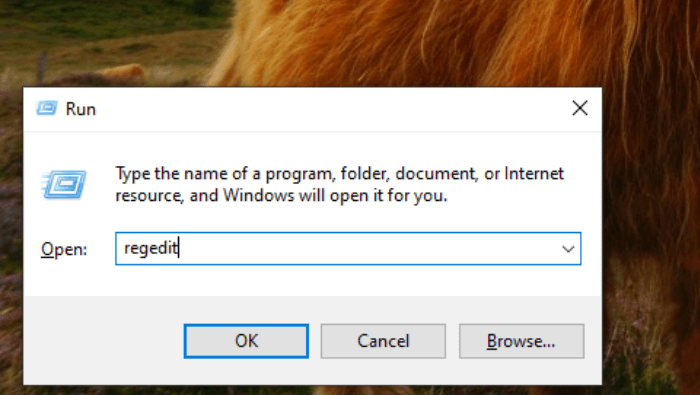
Step 1. Press the Win + R keys to open the Run dialog box. Type regedit and press Enter. When prompted to the User Account Control (UAC), hit Yes to proceed.
Step 2. Navigate to the following path using the left-side panel of Registry Editor:
HKEY_LOCAL_MACHINE\System\CurrentControlSet\Control\CrashControl
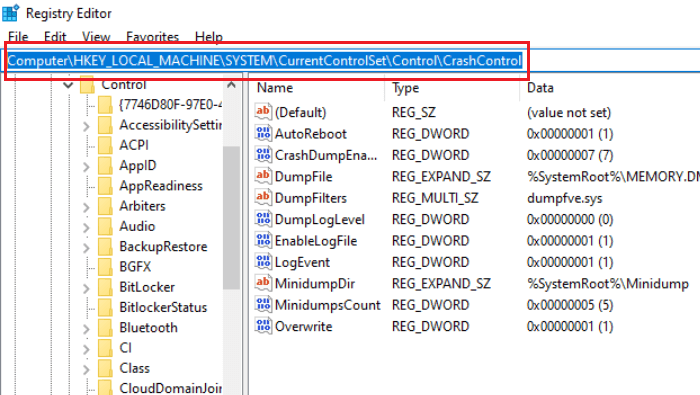
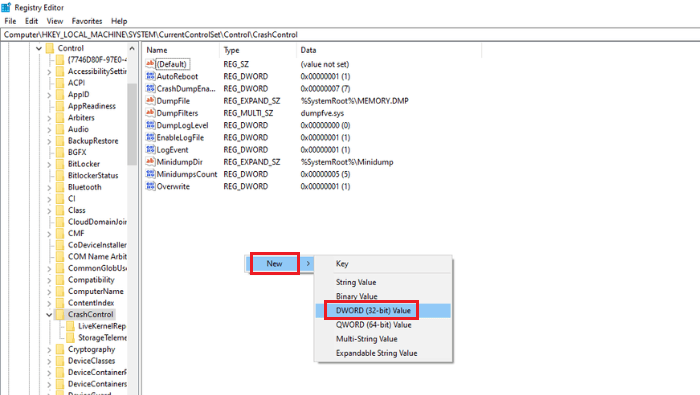
Step 3. With the CrashControl folder selected in the left panel, right-click on an empty space in the right panel. Choose New > DWORD (32-bit) Value.
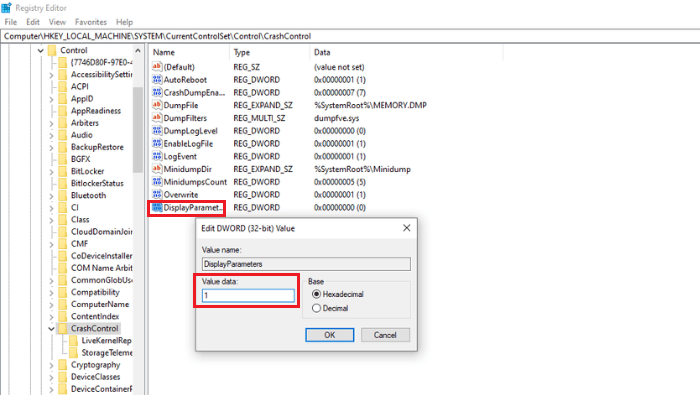
Step 4. Name the new DWORD value DisplayParameters. Double-click it, set the Value data to 1, and click OK.
Step 5. After completing these steps, restart your computer, and you will be able to access BSOD logs.
Share the collected four methods in this article to help more people know where the blue screen of death error logs are stored:
Way 4. Find Blue Screen Error Codes via the Reliability Monitor
Reliability Monitor in the Control Panel can also be used to view blue screen codes/logs. Follow the steps:
Step 1. Type Control in the Run box and press Enter.
Step 2. Navigate to System and Security > System and Maintenance.
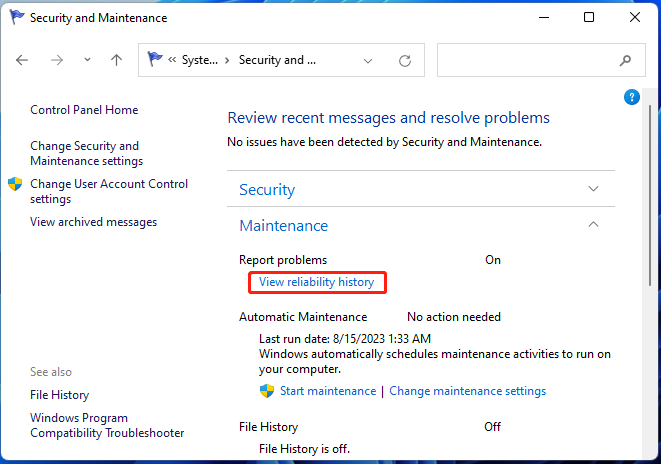
Step 3. Expand the Maintenance category and click View Reliability History.
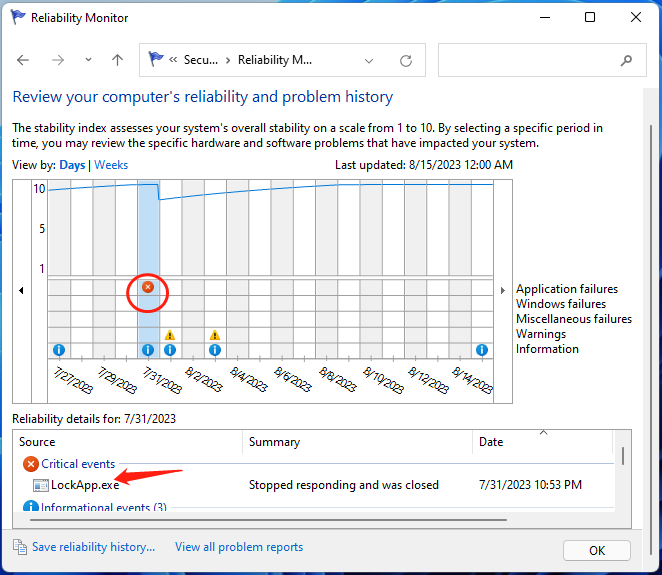
Step 4. You will see a graph displaying information on reliability. Examine for red crosses that indicate errors like BSOD. Click on the event to view the blue screen logs.
Why Check the BSOD Logs?
Checking the Blue Screen of Death (BSOD) logs can provide important information about the cause of a system crash. By analyzing the logs, you can identify the specific error code, driver, or software that caused the crash, allowing you to take appropriate action to fix the issue and prevent future crashes. Additionally, BSOD logs can help technical support teams diagnose and troubleshoot problems more efficiently.
Conclusion
Accessing blue screen logs can help resolve BSOD errors effectively. Whether you choose EaseUS Partition Master for its user-friendly interface and additional features, Event Viewer for detailed log analysis, Registry Editor for advanced settings, or Reliability Monitor for a broad overview, each method provides valuable insights.
EaseUS Partition Master is particularly recommended for its ease of use and comprehensive mechanisms. Try it to streamline your BSOD troubleshooting and improve your system management.
FAQs of How to View Blue Screen Error Logs in Windows 10/11
Do you have further questions about viewing blue screen codes or logs? Check out the FAQs below!
1. Where are Windows blue screen logs stored?
Windows blue screen logs are typically found in the Windows Logs folder under Event Viewer. These logs can be accessed by navigating to Event Viewer > Windows Logs > System.
2. Where is the Windows blue dump file located?
The location varies if Windows is installed on a different drive. They are generally stored in the C:\Windows\Minidump directory.
3. How do I fix the blue screen of death on a Windows PC?
Below are the workable fixes for the blue screen of death (BSOD) error on Windows PC:
- Restart your computer and see if the issue persists.
- Rollback or disable drivers.
- Run a system scan for malware and file corruption.
- Check for hardware issues, like faulty RAM.
- If needed, perform a system restore to a previous working state.
🎯More Information: How to Fix Blue Screen of Death Error in Windows 10
Blue Screen of Death (BSOD) error is one of the common bugs you may encounter for several reasons. It may lead your system from malfunction to a complete crash, and you may end up losing access to your system and stored data. Sometimes, the error may go after rebooting your system. But what if it keeps occurring, and you don’t find any bugcheck for this error?
It would understandably be a frustrating situation. Don’t worry, though!
You can figure out the cause of the error with the help of the BSOD log file. Fortunately, Windows 10 stores such information in a sophisticated way, i.e., by creating a BSOD log file. But it doesn’t get stored in document or text form, which you can open and access directly. Accessing this file is a bit tricky. However, the solutions we’ve provided in this blog can help you locate the file and read it.
How to Find Windows 10 BSOD Logs?
A few DIY methods are shared here to help you check the BSOD logs Windows 10. Follow the steps mentioned against the methods.
Method 1: Use the Event Viewer
Using Event Viewer, you can view the content of event log files, and search & read the BSOD logs to diagnose issues related to the system and functions. It accesses the memory dumps and gathers logs stored on the PC. Event Viewer also provides crucial data on troubleshooting a problem when the system encounters a Blue Screen error.
- Type Event Viewer in Windows Search Box to open it.
- Go to Actions given on the top-left menu.
- Click Actions > Create Custom View.
- Select a time range against the ‘Logged’ option.
- Mark Error in Event Level and then mark Windows Logs in Event logs. Finally, click OK.
- Rename the ‘Custom View’ and click OK.
You’ll be able to see all the error logs on the screen. Locate the error events at the time of the last BSOD.
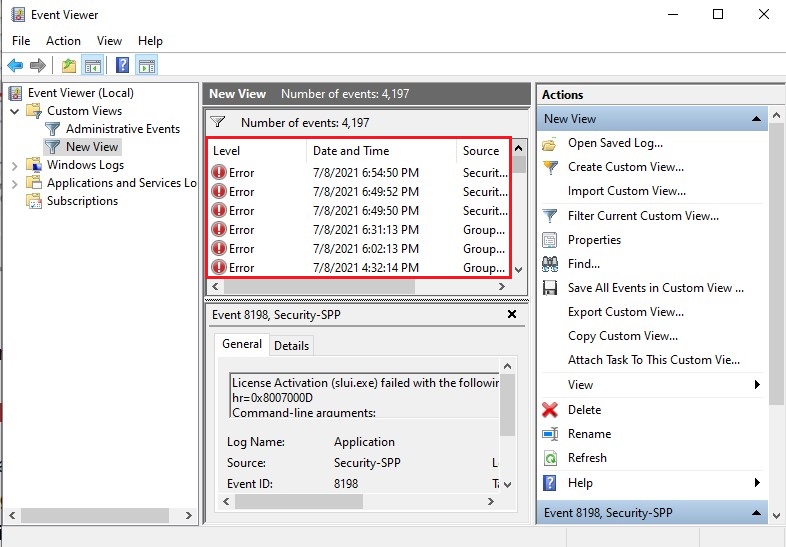
You can also click Details to see a log of apps and system messages, including errors, warnings, and information messages. It also helps in fixing other Windows problems.
Method 2: Use Windows 10 Monitor
Windows 10 Reliability Monitor is a built-in tool, allowing users to know the system’s stability. It lets you analyze if the application is crashing or not responding to issues and builds a PC stability chart. The Reliability Monitor checks out the stability on a scale of 1-10. The larger the scale, the better the system’s stability. You can access this tool through the control panel:
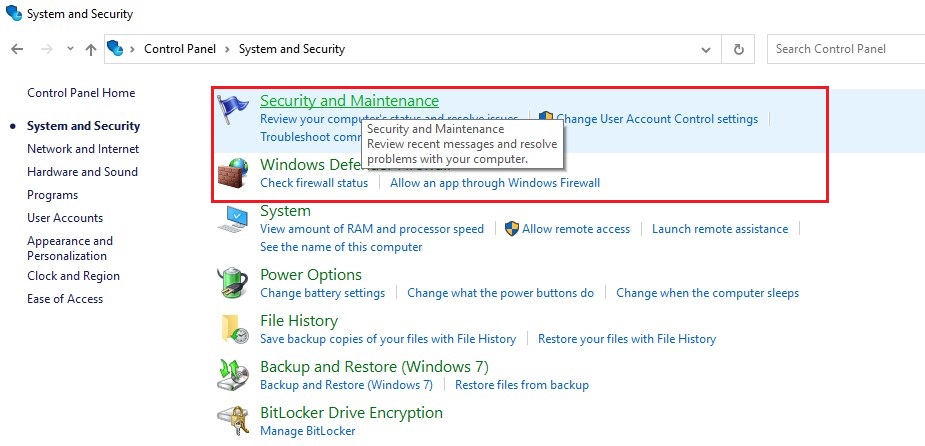
- Open Control Panel and navigate to System and Security.
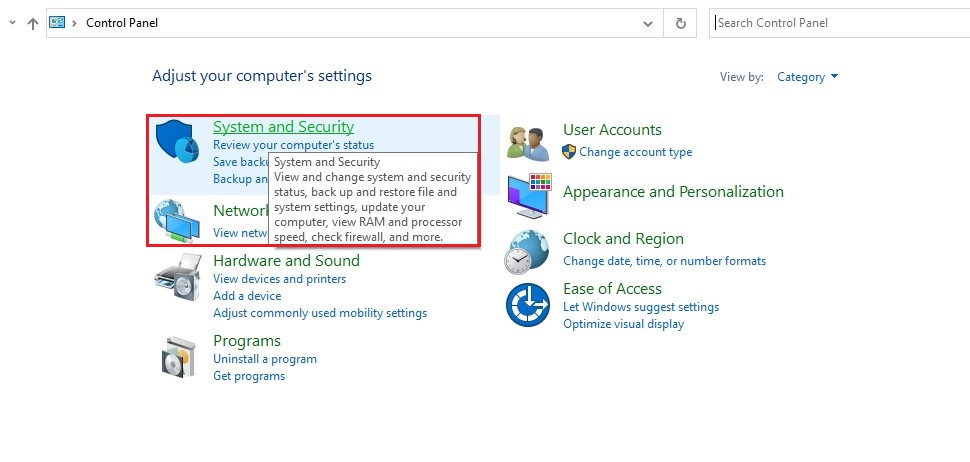
- Next, go to Security and Maintenance.
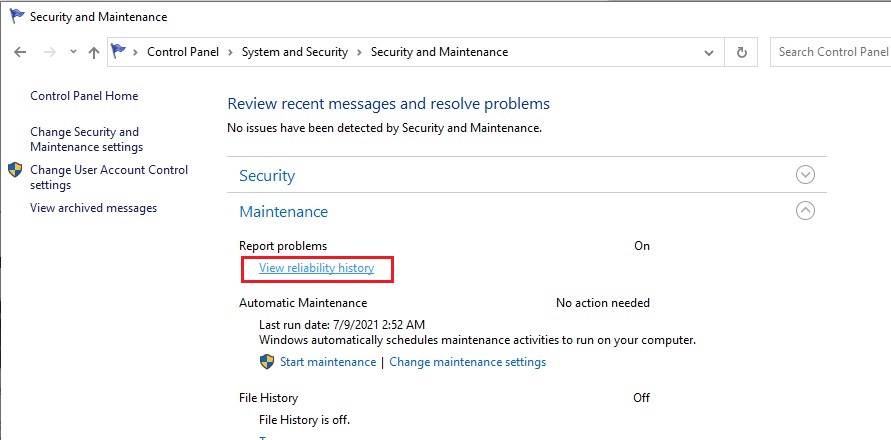
- Navigate to Maintenance > View reliability history.
You will see the reliability data, displaying as a graph, where the cross (x) icons in red show errors and (i) icons in blue show a warning or notable event in the system.
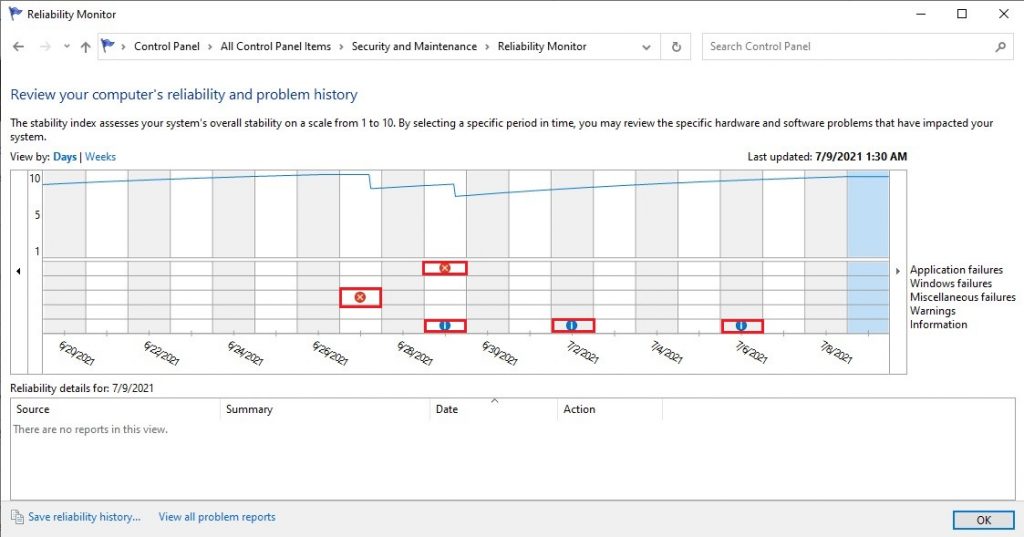
When you click on Error or Warning icons, it will display the problem details. You can expand the details to locate BSOD errors or crashes.
Method 3: Use Registry Editor
You can also use the Registry Editor to check for the Windows 10 BSOD files. Follow the given instructions:
- Open the Run dialog box by pressing Windows + R. Type in regedit, and press Enter.
- Click ‘Yes’ if it asks for your permission to run the utility.
- Then follow HKEY_LOCAL_MACHINE > SYSTEM > CurrentControlSet > Control.
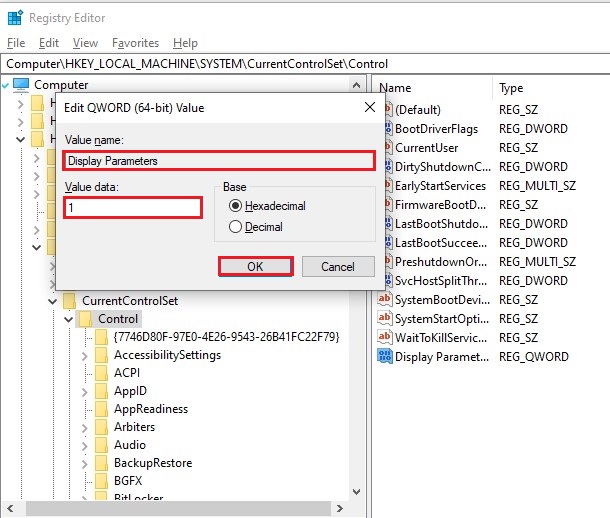
- Go to the right panel of Registry Editor, click New > QWORD (64 bit) Value.
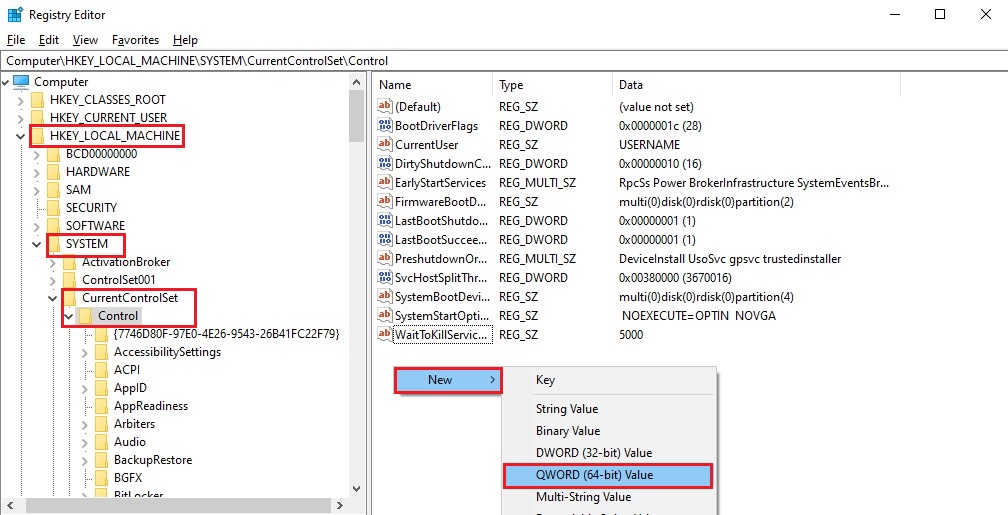
- Rename it as Display Parameters, set the Value data to 1, and then click OK.
- Now, close the Registry Editor and reboot your PC.
I still can’t find where the BSOD logs Windows 10 are located. How would I fix it, and what about my data? Is it possible to recover data from a PC affected by a BSOD error? Don’t worry about your data, as you can recover it with the help of a powerful data recovery tool, such as Stellar Data Recovery Professional. It is a DIY data recovery software, which supports recovery from unbootable, crashed, or BSOD-affected Windows PCs and laptops. You can download its trial version to check its functionality and data recovery success rates.
Locating and accessing the Windows 10 BSOD logs is not always child’s play. However, you can refer to the methods given in this blog. Also, don’t forget to check the BSOD fixes. Finally, if you want to get back any lost data from the BSOD-affected system, use reliable data recovery software. The software can help you retrieve data even from non-booting or crashed Windows systems.
Was this article helpful?
YES0
NO